Open Access
Fig. 7.
Download original image
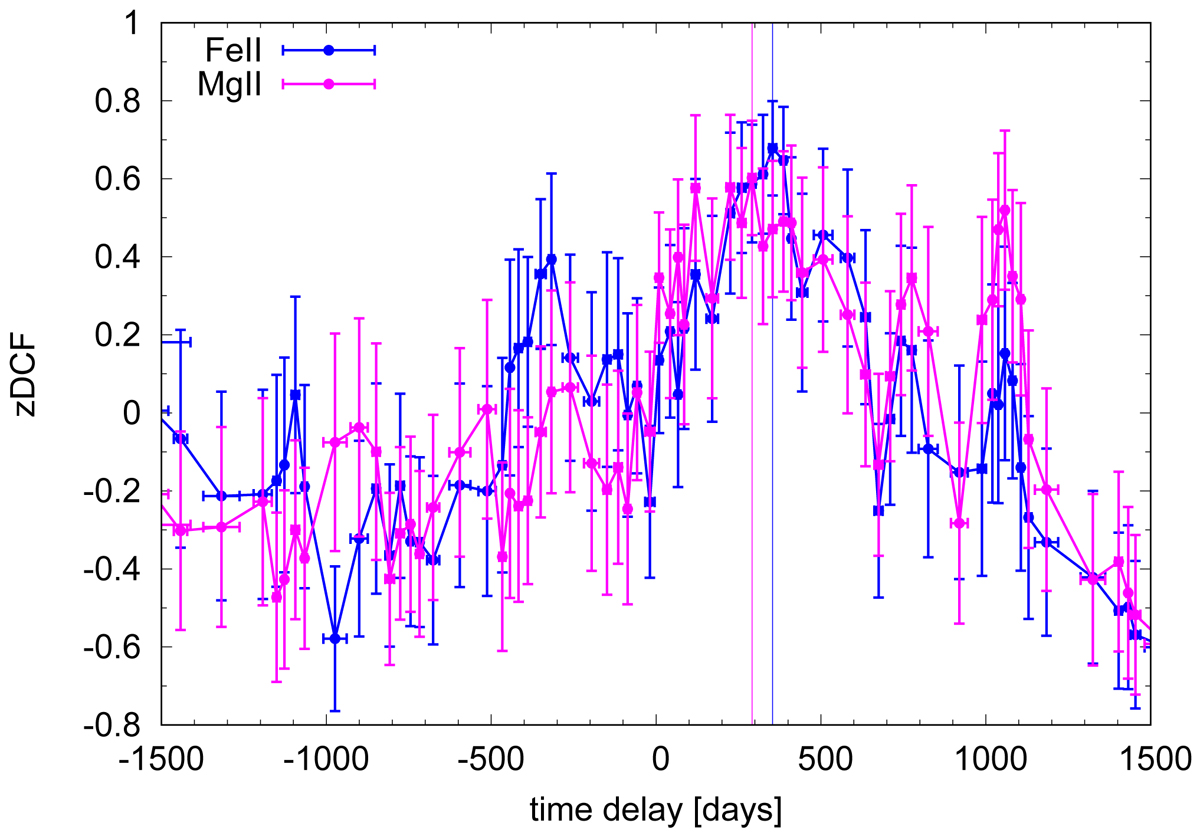
zDCF correlation coefficient as a function of the time delay in the observer’s frame for the total Fe II (blue line) and the total Mg II emission (magenta line). The vertical lines denote the peak values for each corresponding line.
Current usage metrics show cumulative count of Article Views (full-text article views including HTML views, PDF and ePub downloads, according to the available data) and Abstracts Views on Vision4Press platform.
Data correspond to usage on the plateform after 2015. The current usage metrics is available 48-96 hours after online publication and is updated daily on week days.
Initial download of the metrics may take a while.