Fig. 4.
Download original image
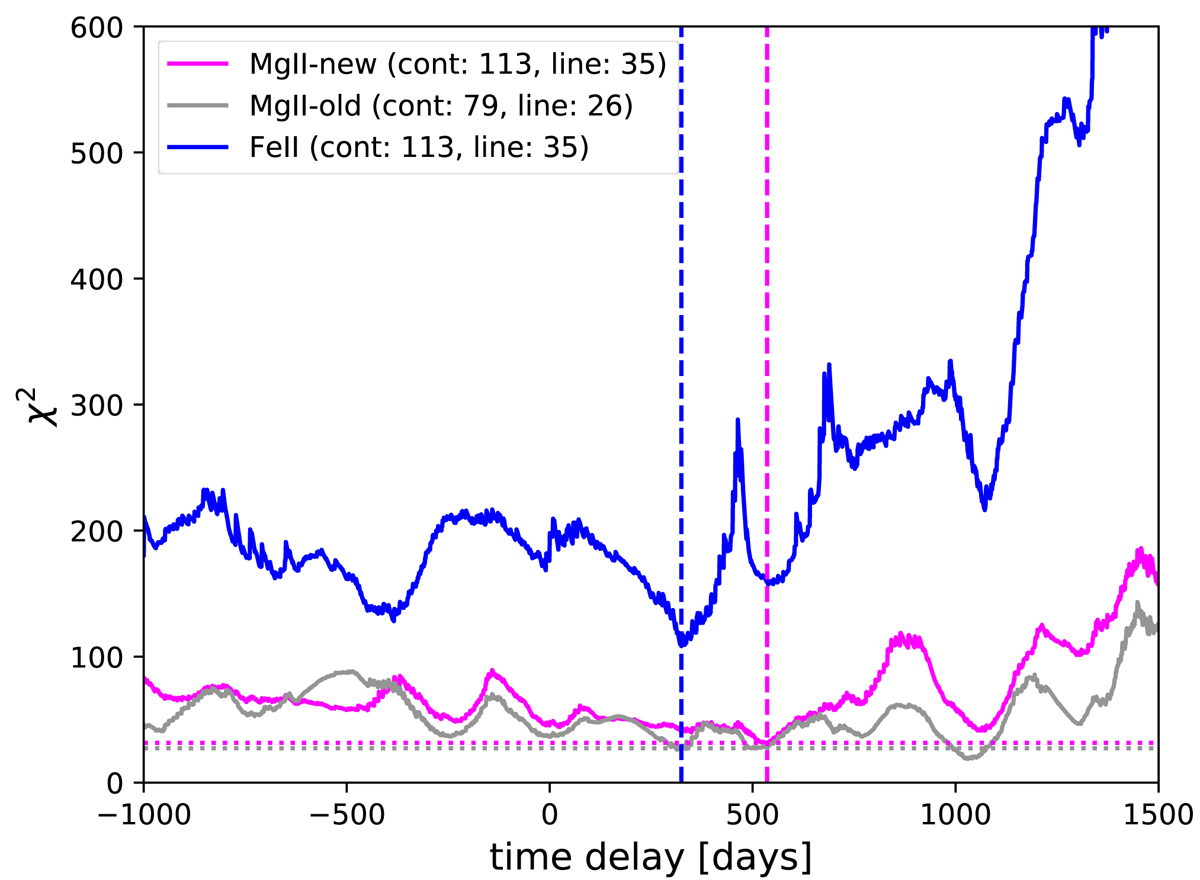
χ2 value as a function of the time delay in the observer’s frame for the Mg II line emission (magenta line) as well as for the Fe II line emission (blue line). The global χ2 minima for each line are depicted by the vertical dashed lines. The χ2 time-delay dependence for the previous, shorter continuum-Mg II light curves (Czerny et al. 2019) is shown as a gray line with the global minimum at the time delay twice as large as for the current data. Cont:79, 113 and line:26, 35 represents the number of observations.
Current usage metrics show cumulative count of Article Views (full-text article views including HTML views, PDF and ePub downloads, according to the available data) and Abstracts Views on Vision4Press platform.
Data correspond to usage on the plateform after 2015. The current usage metrics is available 48-96 hours after online publication and is updated daily on week days.
Initial download of the metrics may take a while.