Fig. 3.
Download original image
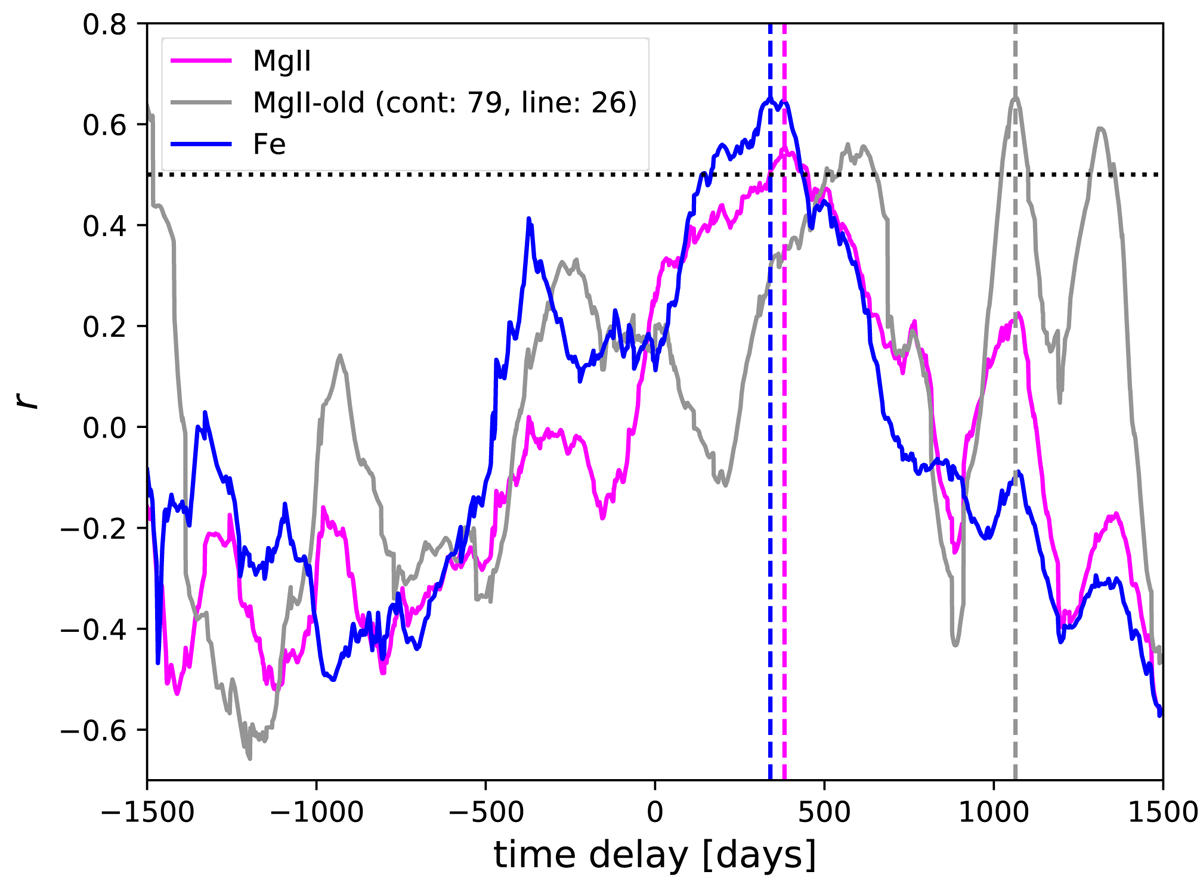
Interpolated cross-correlation function as a function of the time delay in the observer’s frame for the total Mg II (magenta line) and the total Fe II emission (blue line). The dashed vertical lines mark the corresponding time-delay peak values. The correlation coefficient at the peak value for the Fe II pseudo-continuum is larger than the correlation coefficient at the time-delay peak of the Mg II line. The dotted horizontal line marks r = 0.5. We also show the previous ICCF (Czerny et al. 2019) when the peak time delay was at ∼1064 days; see the solid gray line. Cont:79 and line:26 represents the number of observations used in (Czerny et al. 2019).
Current usage metrics show cumulative count of Article Views (full-text article views including HTML views, PDF and ePub downloads, according to the available data) and Abstracts Views on Vision4Press platform.
Data correspond to usage on the plateform after 2015. The current usage metrics is available 48-96 hours after online publication and is updated daily on week days.
Initial download of the metrics may take a while.