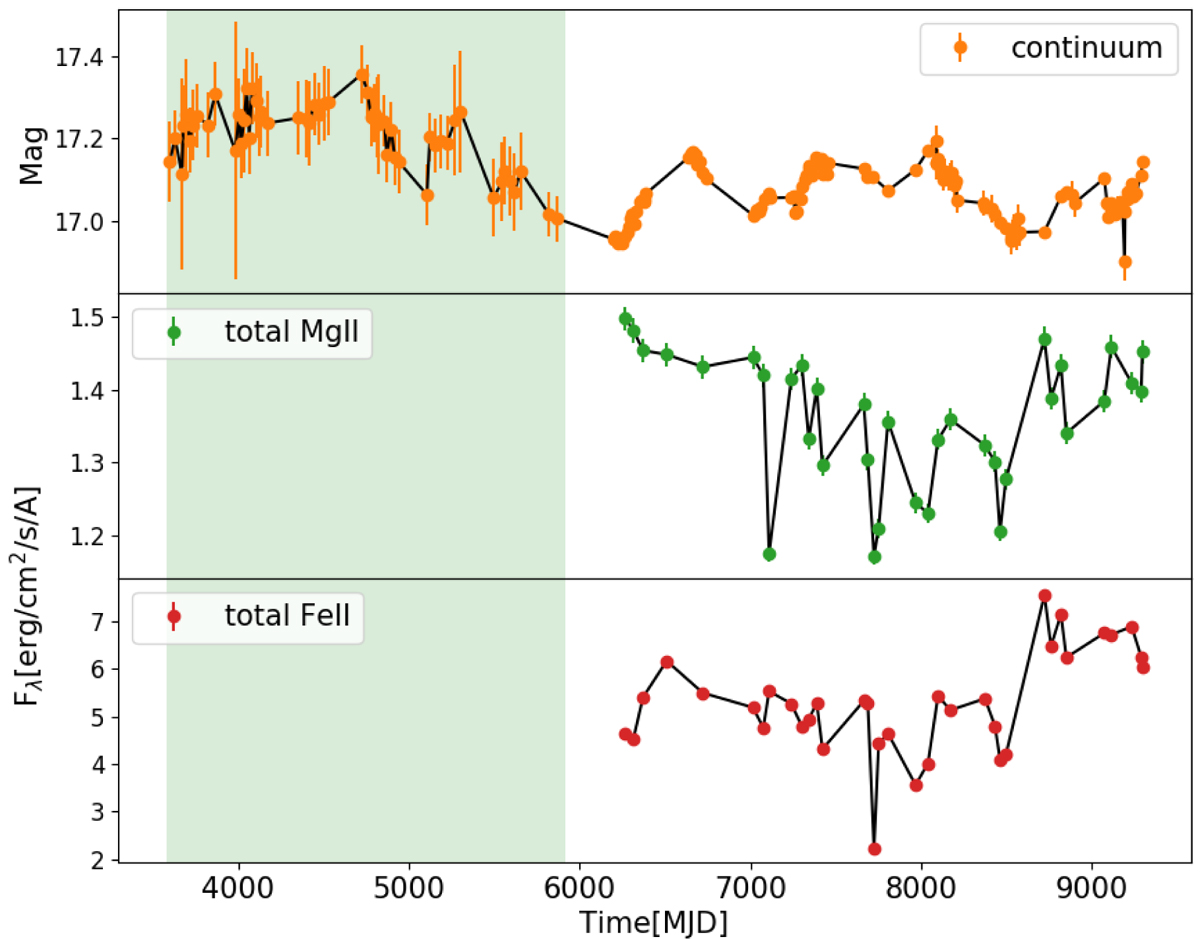
Fig. 2.
Download original image
Long-term photometric light curve (upper panel), including CATALINA measurements (light green shaded region) from Czerny et al. (2019), and total Mg II (middle panel) and Fe II (lower panel) light curves. Photometric observations are in magnitudes (panel 1), but Mg II and Fe II fluxes are in units of 10−16 and 10−17 erg s−1 cm−2. We used only the non-shaded region.
Current usage metrics show cumulative count of Article Views (full-text article views including HTML views, PDF and ePub downloads, according to the available data) and Abstracts Views on Vision4Press platform.
Data correspond to usage on the plateform after 2015. The current usage metrics is available 48-96 hours after online publication and is updated daily on week days.
Initial download of the metrics may take a while.