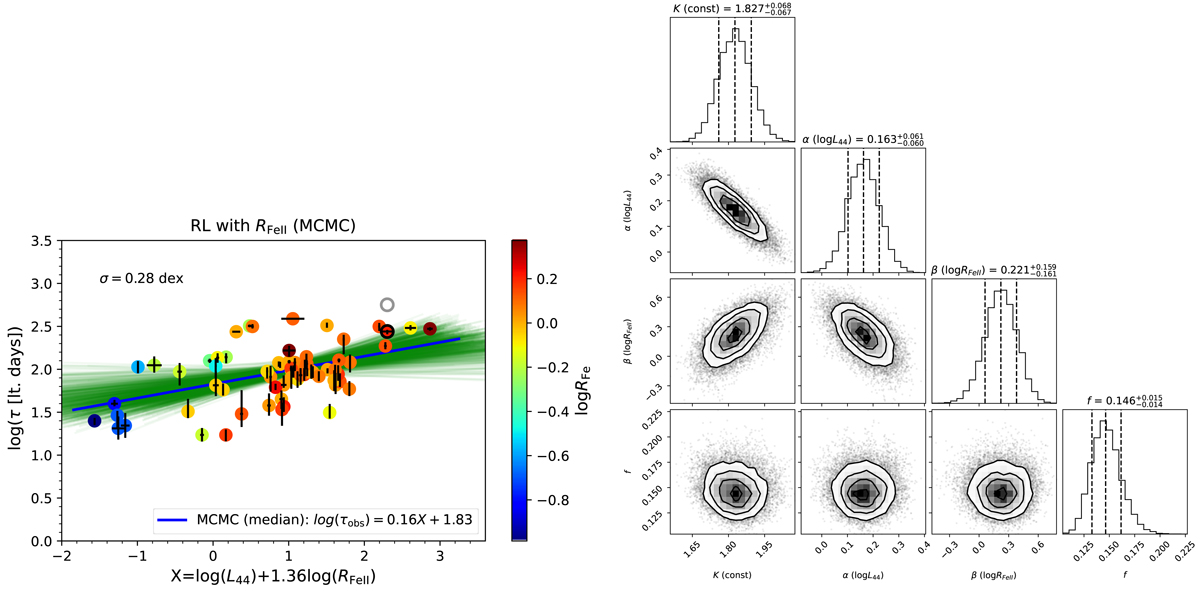
Fig. 18.
Download original image
Extended RL relation including the relative Fe II strength, RFe II. Left panel: median relation (blue line) is inferred by maximizing the likelihood function. Green lines show 1000 random selections from the parameter distribution. 66 Mg II time-delay measurements are color-coded to depict log RFe III according to the color axis on the right. The RMS scatter is 0.28 dex. Right panel: corner plot shows the parameter distributions inferred from the MCMC method. The parameter uncertainties correspond to 16th and 84th percentiles.
Current usage metrics show cumulative count of Article Views (full-text article views including HTML views, PDF and ePub downloads, according to the available data) and Abstracts Views on Vision4Press platform.
Data correspond to usage on the plateform after 2015. The current usage metrics is available 48-96 hours after online publication and is updated daily on week days.
Initial download of the metrics may take a while.