Fig. 17.
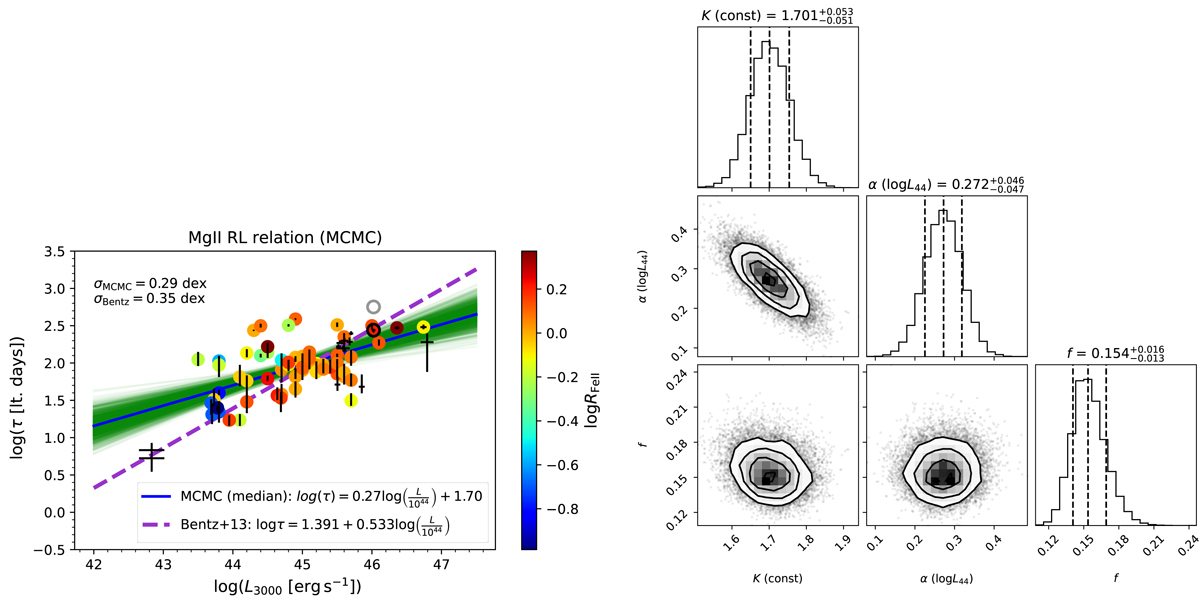
Download original image
Mg II maximum likelihood RL relation determined using the MCMC algorithm (left panel). The coefficients as well as the RMS scatter are consistent within the uncertainties with the classical fitting algorithm (see Fig. 16). CTS C30.10 is depicted using the black circle, while the previous time-delay measurement, approximately twice as long, is represented by a gray circle. The dashed violet line shows the Bentz RL relation with a slope of ∼0.5, which was adjusted for the continuum luminosity at 3000 Å. Right panel: corner plot representation of the distribution histograms for the two parameters α (slope) and K constant in the linear fit of logτ = α log L44 + K to the Mg II data. The likelihood function is included the underestimation factor f, whose distribution is also shown.
Current usage metrics show cumulative count of Article Views (full-text article views including HTML views, PDF and ePub downloads, according to the available data) and Abstracts Views on Vision4Press platform.
Data correspond to usage on the plateform after 2015. The current usage metrics is available 48-96 hours after online publication and is updated daily on week days.
Initial download of the metrics may take a while.