Fig. 16.
Download original image
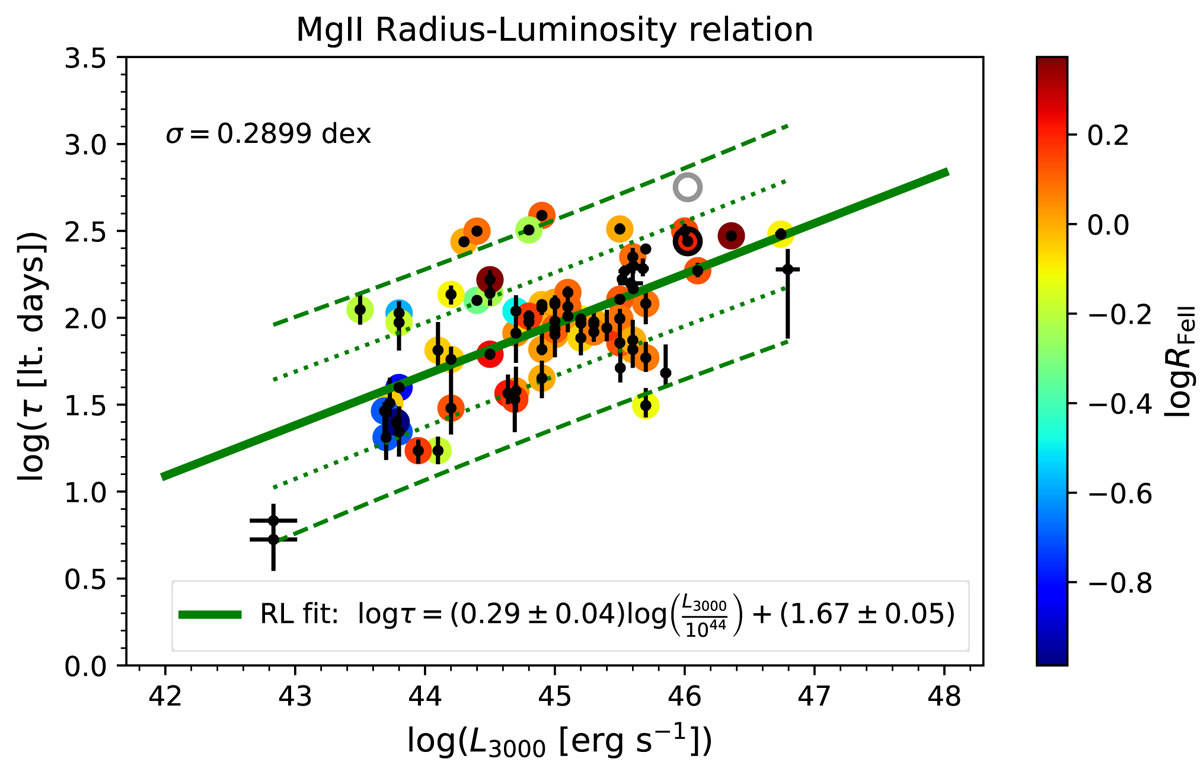
Radius-luminosity relation for the currently available 78 Mg II sources. The best-fit relation determined by the classical least-squares fitting is indicated by the solid green line. The updated Mg II emission-line time delay of ![]() days is depicted by a black circle, while the previous measurement is shown as a gray circle for comparison. The overall scatter is ∼0.29 dex. For 66 sources, we have available measurements of the relative Fe II strength (RFe II parameter), which are color-coded according to the axis on the right. The dotted and dashed green lines show 1 and 2σ prediction intervals, respectively, for the sample of 78 Mg II RM sources.
days is depicted by a black circle, while the previous measurement is shown as a gray circle for comparison. The overall scatter is ∼0.29 dex. For 66 sources, we have available measurements of the relative Fe II strength (RFe II parameter), which are color-coded according to the axis on the right. The dotted and dashed green lines show 1 and 2σ prediction intervals, respectively, for the sample of 78 Mg II RM sources.
Current usage metrics show cumulative count of Article Views (full-text article views including HTML views, PDF and ePub downloads, according to the available data) and Abstracts Views on Vision4Press platform.
Data correspond to usage on the plateform after 2015. The current usage metrics is available 48-96 hours after online publication and is updated daily on week days.
Initial download of the metrics may take a while.