Fig. 11.
Download original image
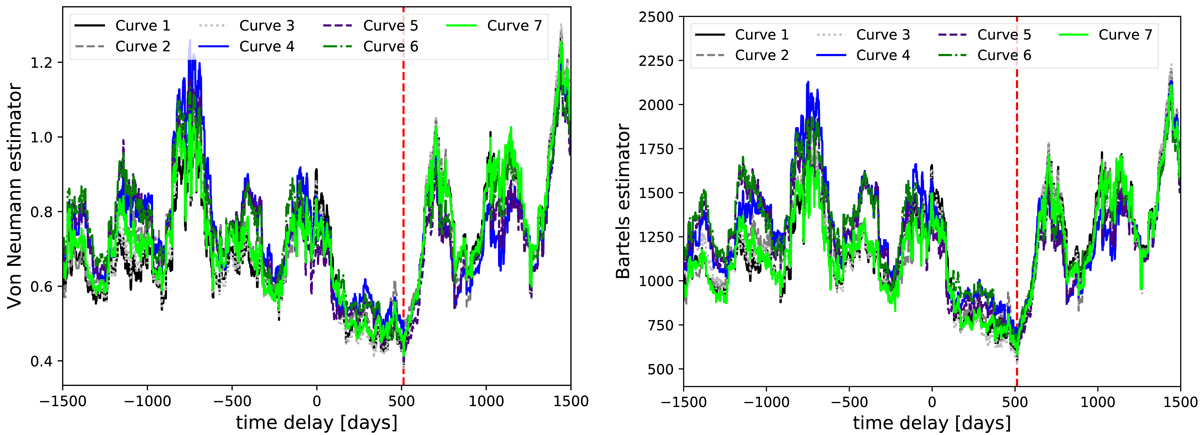
Estimators of data randomness/regularity as a function of the time delay in the observer’s frame. Left panel: von Neumann estimator for seven Mg II line light curves according to the legend. Right panel: Bartels estimator value for the same Mg II light curves in the observer’s frame. The dashed red line represents the estimated time delay.
Current usage metrics show cumulative count of Article Views (full-text article views including HTML views, PDF and ePub downloads, according to the available data) and Abstracts Views on Vision4Press platform.
Data correspond to usage on the plateform after 2015. The current usage metrics is available 48-96 hours after online publication and is updated daily on week days.
Initial download of the metrics may take a while.