Open Access
Fig. 1.
Download original image
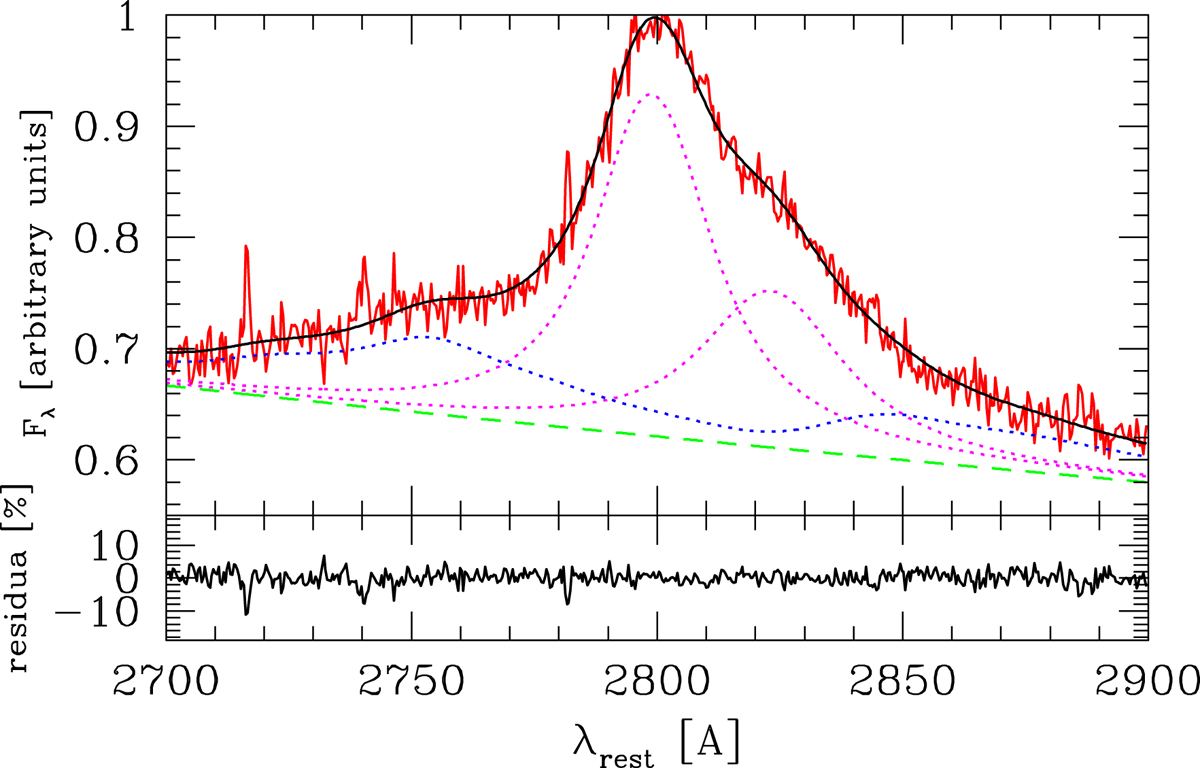
Observation 36 from the SALT telescope (red) and the model (black). The dashed green line shows the underlying continuum from the accretion disk, the dotted blue line is the Fe II pseudo-continuum, and the dotted magenta lines represent the two kinematic components of the Mg II line.
Current usage metrics show cumulative count of Article Views (full-text article views including HTML views, PDF and ePub downloads, according to the available data) and Abstracts Views on Vision4Press platform.
Data correspond to usage on the plateform after 2015. The current usage metrics is available 48-96 hours after online publication and is updated daily on week days.
Initial download of the metrics may take a while.