Fig. 18
Download original image
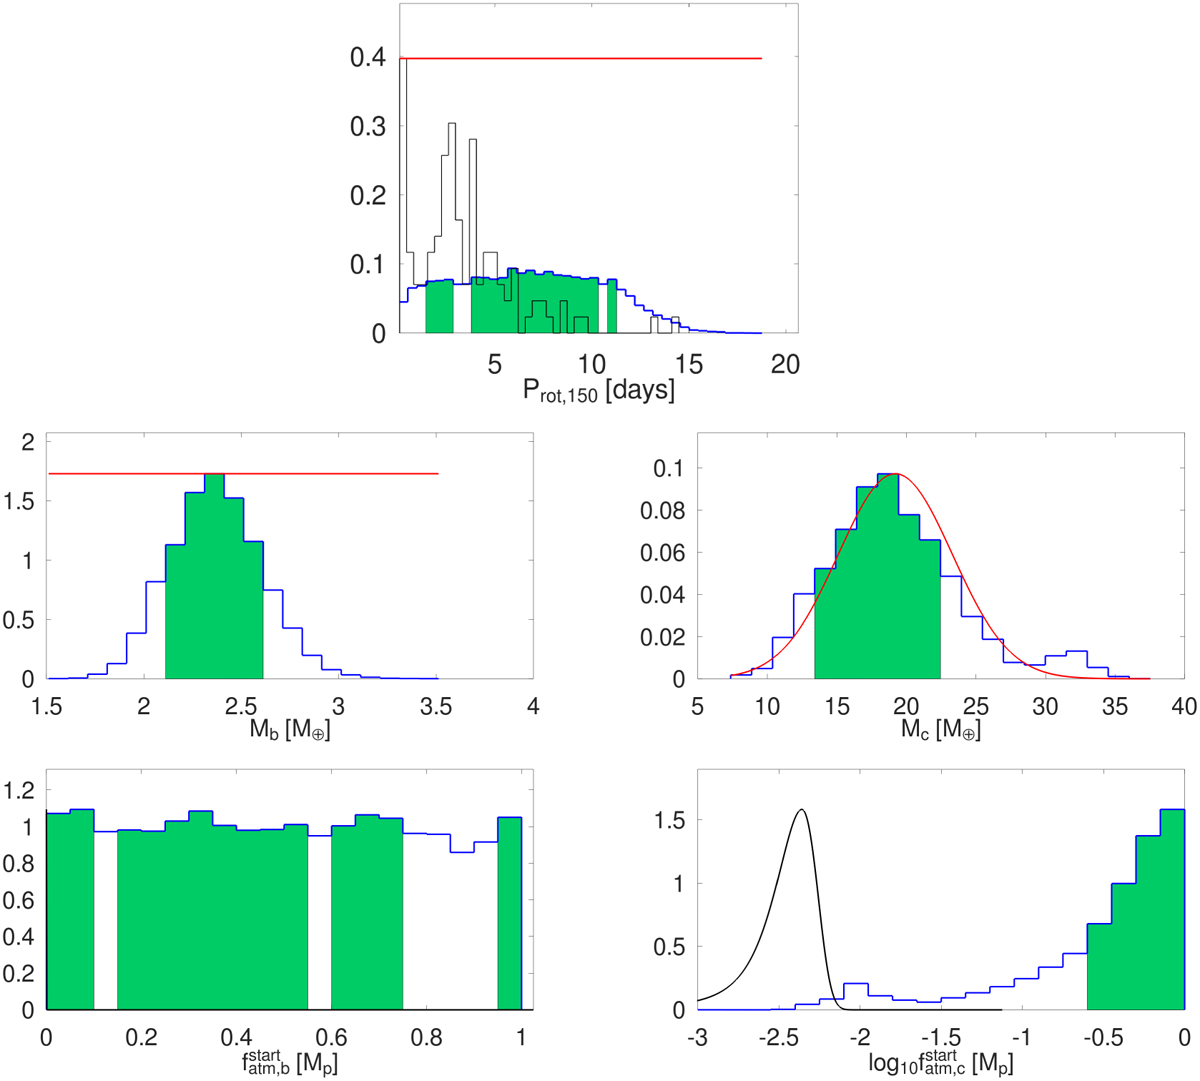
Results of the PASTA modelling. Upper panel: posterior-distribution of the stellar rotation rate at an age of 150 Myr. The black line represents the distribution measured from a sample of open cluster stars of comparable mass and age (Johnstone et al. 2015). Middle and lower panels: posterior-distributions of planetary mass (middle) and initial atmospheric mass fraction (bottom) for HD 93963 Ab and c. The red lines represent the imposed priors (uniform or Gaussian), while in the bottom-right panel the black line shows the current atmospheric mass fraction estimated by PASTA on the basis of the measured planetary mass and radius and estimated equilibrium temperature. We note that the x axis of the bottom-left panel is in linear scale, while that of the bottom-right panel is in logarithmic scale.
Current usage metrics show cumulative count of Article Views (full-text article views including HTML views, PDF and ePub downloads, according to the available data) and Abstracts Views on Vision4Press platform.
Data correspond to usage on the plateform after 2015. The current usage metrics is available 48-96 hours after online publication and is updated daily on week days.
Initial download of the metrics may take a while.