Fig. 16
Download original image
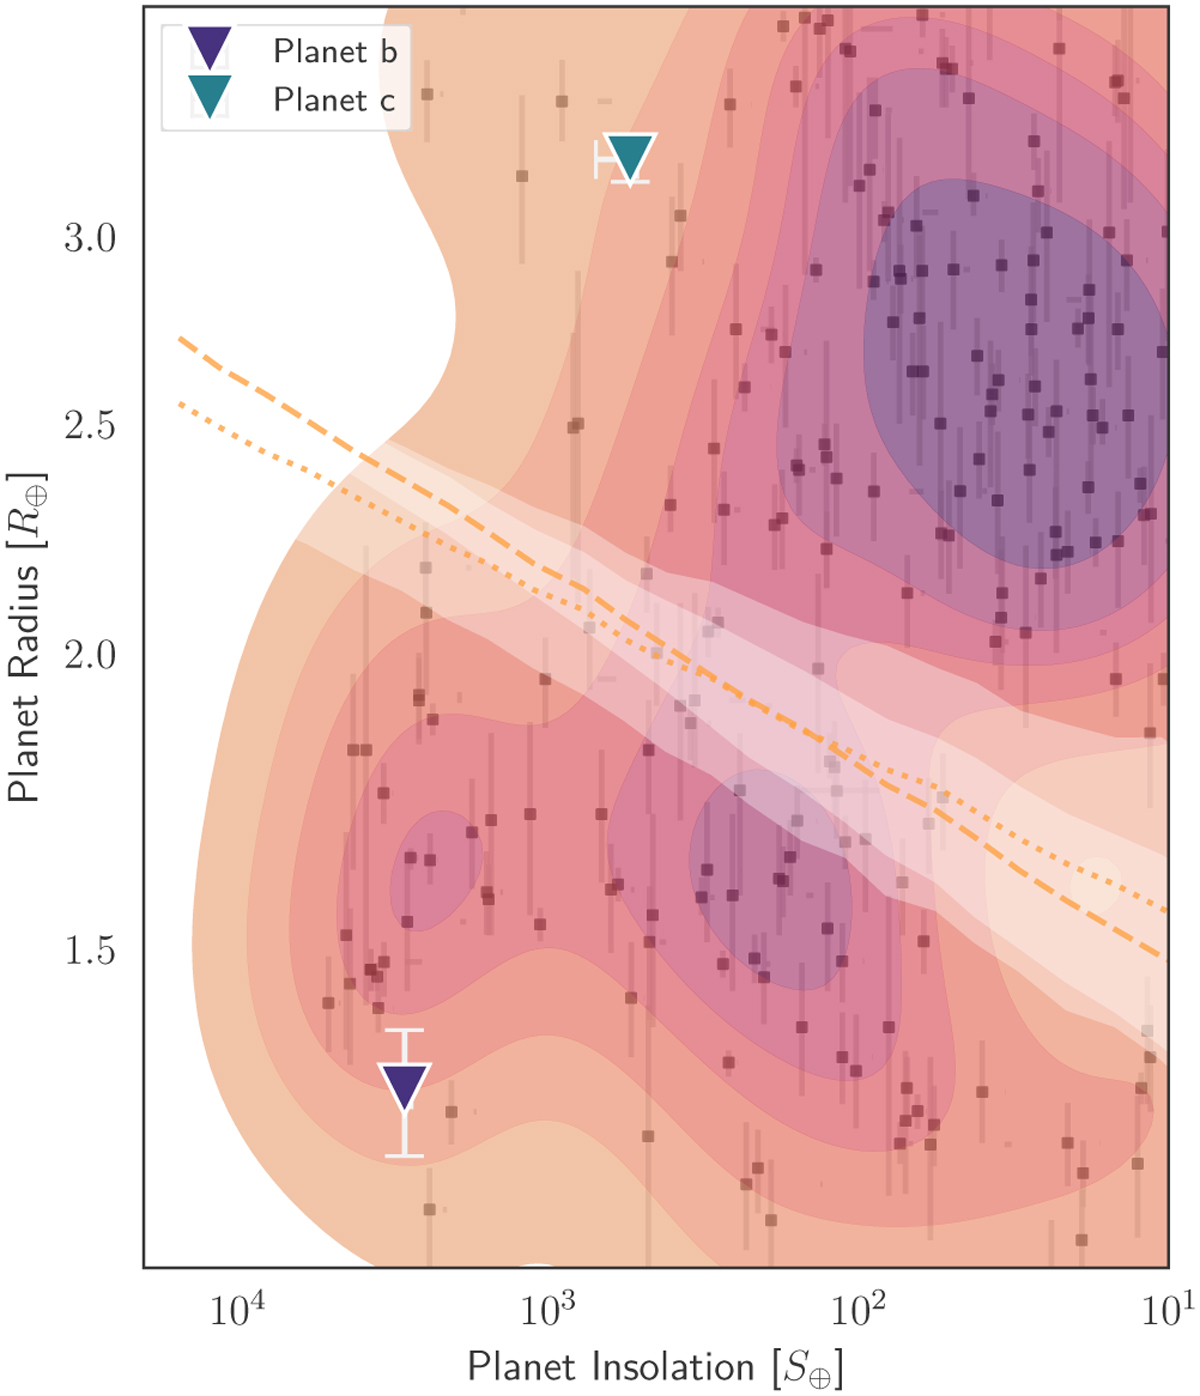
HD 93963 A b & c (filled triangles) as a function of planetary radius and insolation, compared with the population of exoplanets. Colours represent a kernel density estimation (KDE) applied to small (Rp < 4 R⊕), transiting planets retrieved from the NASA Exoplanet Archive (Akeson et al. 2013). The dashed and dotted lines (with associated 1 σ white error bands) show estimates for the position of the evaporation valley from Martinez et al. (2019) and Van Eylen et al. (2018) respectively.
Current usage metrics show cumulative count of Article Views (full-text article views including HTML views, PDF and ePub downloads, according to the available data) and Abstracts Views on Vision4Press platform.
Data correspond to usage on the plateform after 2015. The current usage metrics is available 48-96 hours after online publication and is updated daily on week days.
Initial download of the metrics may take a while.