Fig. 14
Download original image
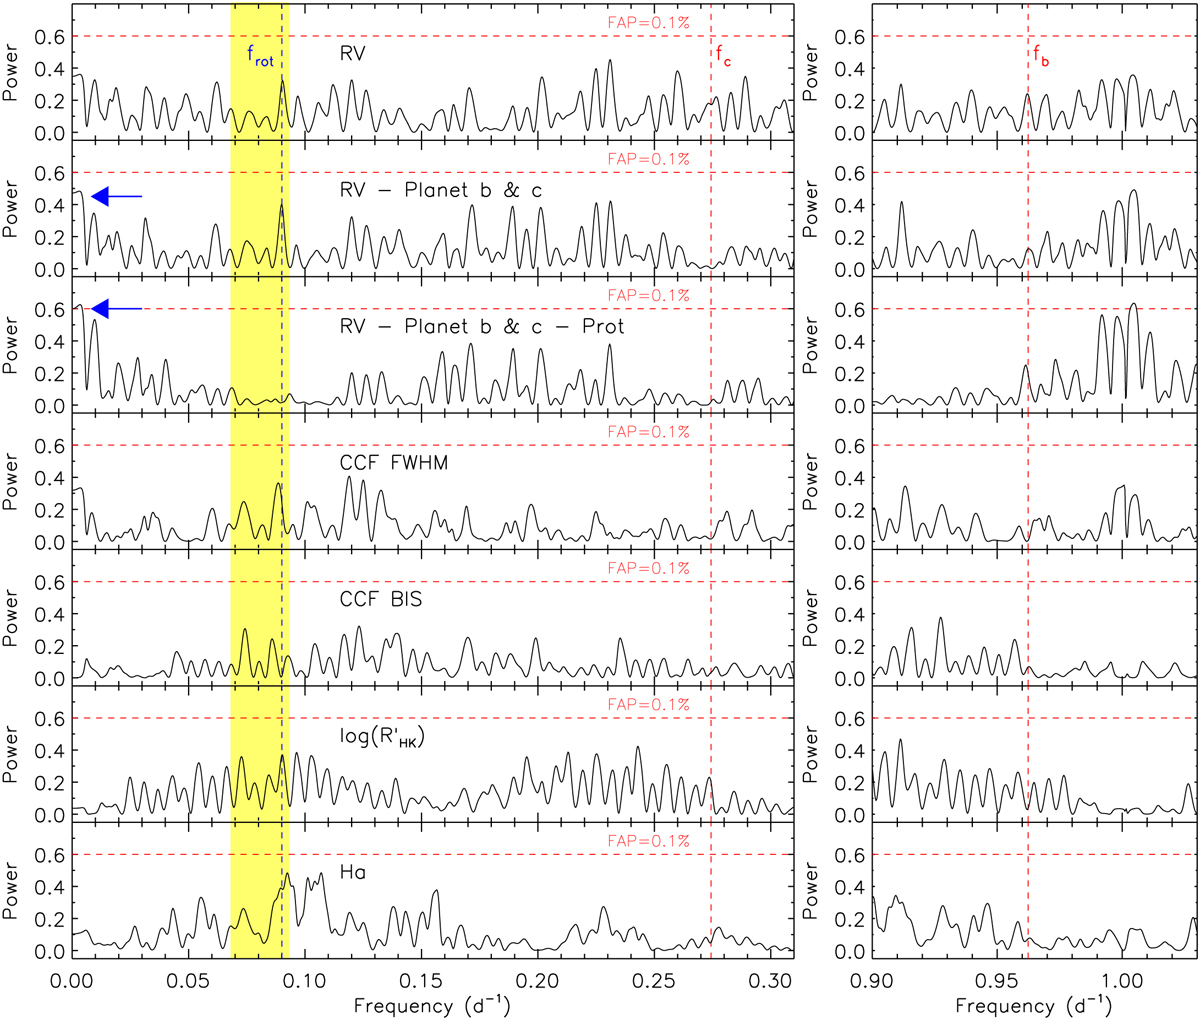
Generalized Lomb-Scargle periodograms of the SOPHIE RV measurements and activity indicators. The right and left columns cover two frequency ranges encompassing the orbital frequencies of HD 93963 A b and c (fb = 0.96 d−1 and fc = 0.27 d−1; vertical dashed red lines) and the 68.3% credible interval of the rotation frequency of the star (yellow area), as estimated from the TESS light curve. The vertical dashed blue line marks the rotation frequency of the star (frot = 0.09−1, which implies Prot ~ 11.1 d), as derived from the SOPHIE data. From top to bottom: RV data; RV residuals after subtracting the signals of the two transiting planets; RV residuals after subtracting the signals of the star and of the two transiting planets; FWHM and BIS of the CCF; log ![]() ; Hα. The horizontal dashed red lines mark the 0.1% false alarm probability. The blue arrow marks the excess of power at low frequencies detected in the SOPHIE RVs.
; Hα. The horizontal dashed red lines mark the 0.1% false alarm probability. The blue arrow marks the excess of power at low frequencies detected in the SOPHIE RVs.
Current usage metrics show cumulative count of Article Views (full-text article views including HTML views, PDF and ePub downloads, according to the available data) and Abstracts Views on Vision4Press platform.
Data correspond to usage on the plateform after 2015. The current usage metrics is available 48-96 hours after online publication and is updated daily on week days.
Initial download of the metrics may take a while.