Open Access
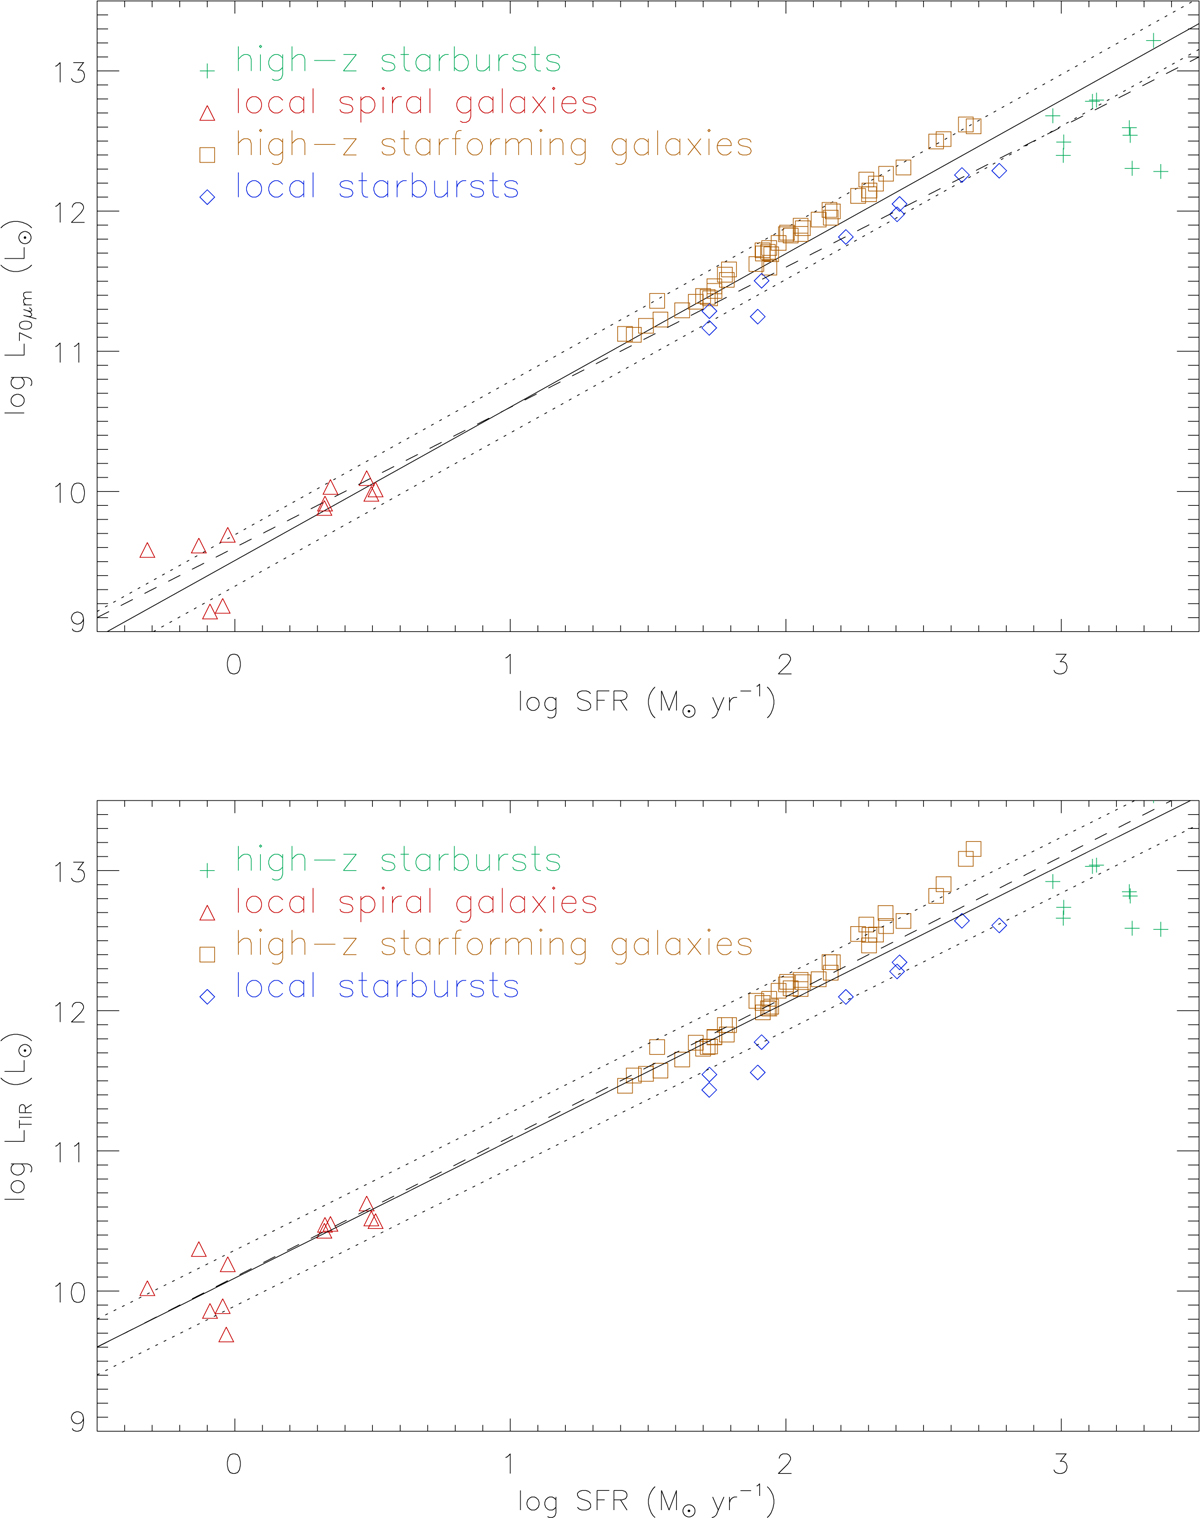
Fig. 2.
Download original image
Upper panel: model SFR–70 μm correlation. Lower panel: model SFR–TIR correlation. The solid and dotted lines represent an outlier-resistant linear regression and its uncertainty. The dashed line corresponds to a linear correlation.
Current usage metrics show cumulative count of Article Views (full-text article views including HTML views, PDF and ePub downloads, according to the available data) and Abstracts Views on Vision4Press platform.
Data correspond to usage on the plateform after 2015. The current usage metrics is available 48-96 hours after online publication and is updated daily on week days.
Initial download of the metrics may take a while.