Open Access
Fig. 11.
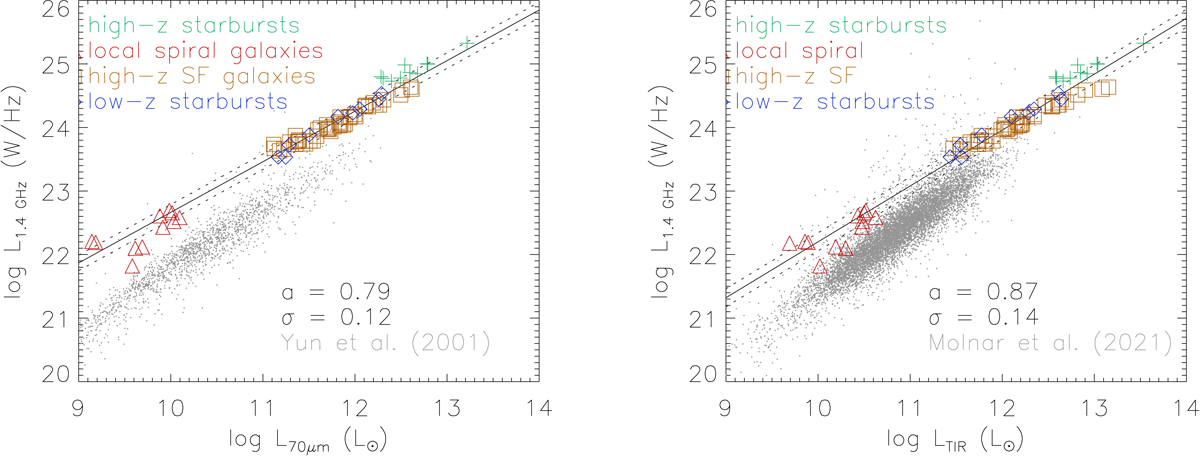
Download original image
Calorimeter models. TIR–1.4 GHz correlation. Colored symbols mark the model galaxies, black solid and dotted lines show the model linear regression, and gray dots show observations.
Current usage metrics show cumulative count of Article Views (full-text article views including HTML views, PDF and ePub downloads, according to the available data) and Abstracts Views on Vision4Press platform.
Data correspond to usage on the plateform after 2015. The current usage metrics is available 48-96 hours after online publication and is updated daily on week days.
Initial download of the metrics may take a while.