Fig. 9
Download original image
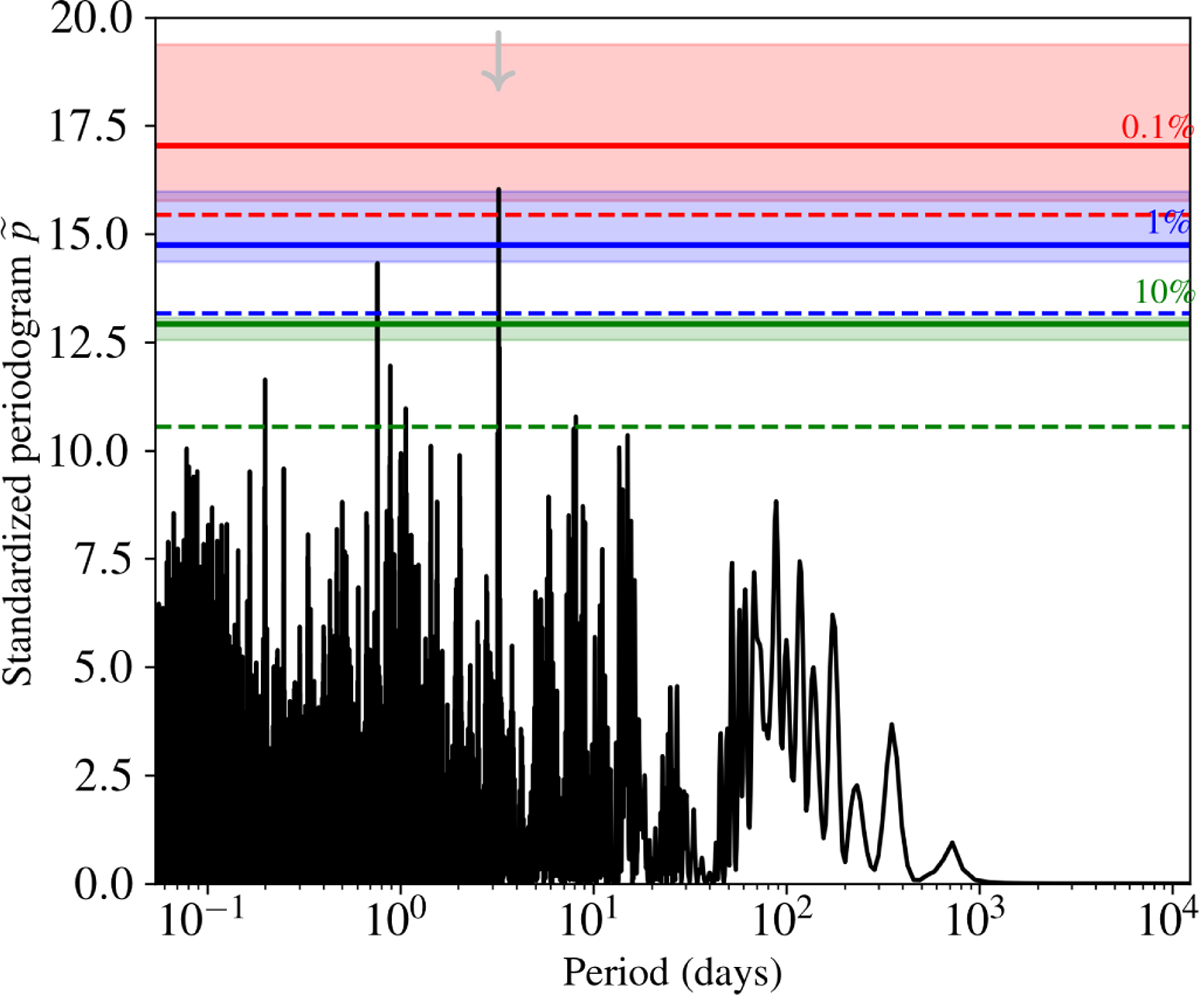
Standardized Lomb–Scargle periodogram of the a CenB RV residuals. The noise model ℳd used to create these residuals is taken from Dumusque et al. (2012). p-values estimated by a classical bootstrap procedure (see text) are shown with the dashed lines. Mean p-values derived with algorithm 2 are shown with solid lines, and their credibility interval with the shaded regions. The peak at 3.2 days is shown by the gray vertical arrow.
Current usage metrics show cumulative count of Article Views (full-text article views including HTML views, PDF and ePub downloads, according to the available data) and Abstracts Views on Vision4Press platform.
Data correspond to usage on the plateform after 2015. The current usage metrics is available 48-96 hours after online publication and is updated daily on week days.
Initial download of the metrics may take a while.