Fig. 7
Download original image
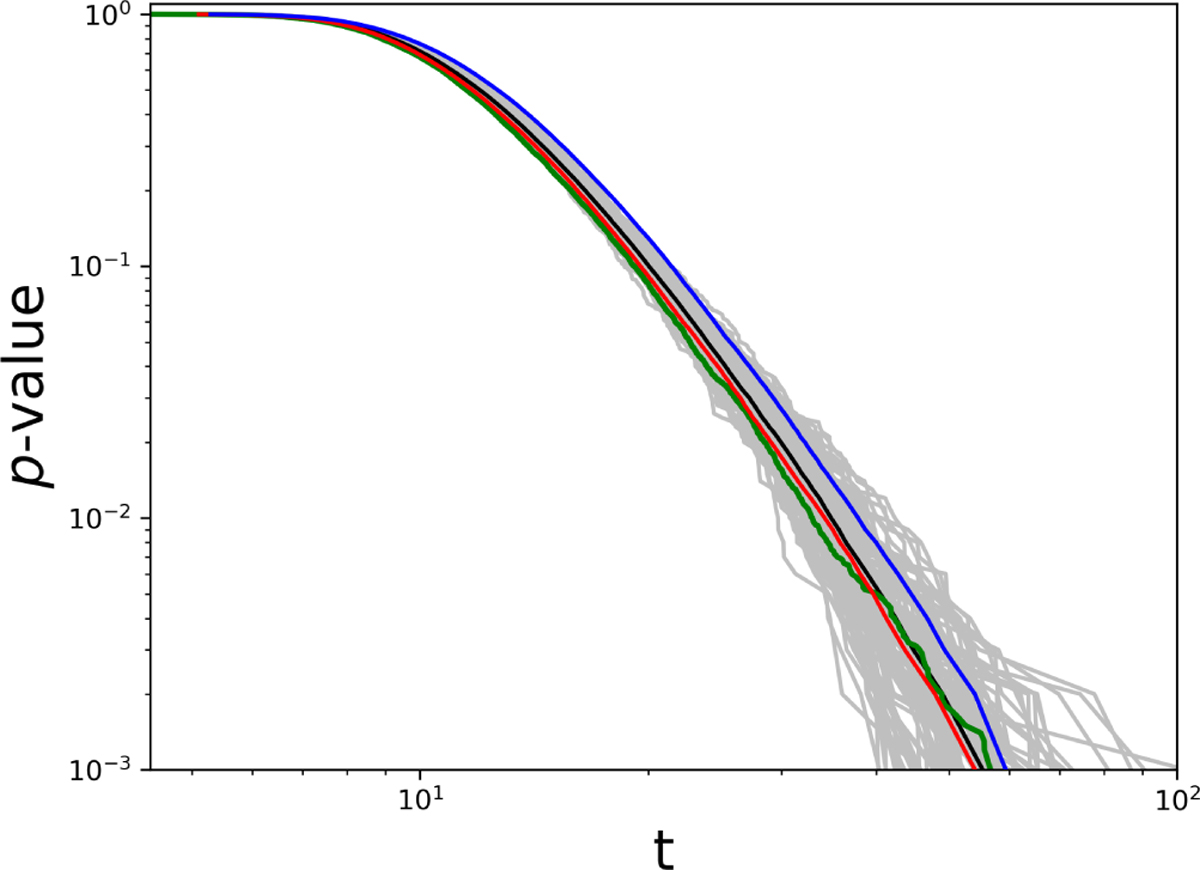
P-value estimates resulting for different choices of the priors πd in row 13 of algorithm 2. Gray and black show the results for a Gaussian prior centered on the estimated parameter values with the scale parameters taken as 3 σ, with σ the estimated standard deviation of the parameter estimates. Gray shows examples of p-values ![]() , and black shows the mean p-value. Red and blue show results for uniform priors with intervals centered on the estimated parameter values and widths taken as 1 σ (red) and 10 σ (blue). The true (oracle) p-value is shown in green.
, and black shows the mean p-value. Red and blue show results for uniform priors with intervals centered on the estimated parameter values and widths taken as 1 σ (red) and 10 σ (blue). The true (oracle) p-value is shown in green.
Current usage metrics show cumulative count of Article Views (full-text article views including HTML views, PDF and ePub downloads, according to the available data) and Abstracts Views on Vision4Press platform.
Data correspond to usage on the plateform after 2015. The current usage metrics is available 48-96 hours after online publication and is updated daily on week days.
Initial download of the metrics may take a while.