Fig. 5
Download original image
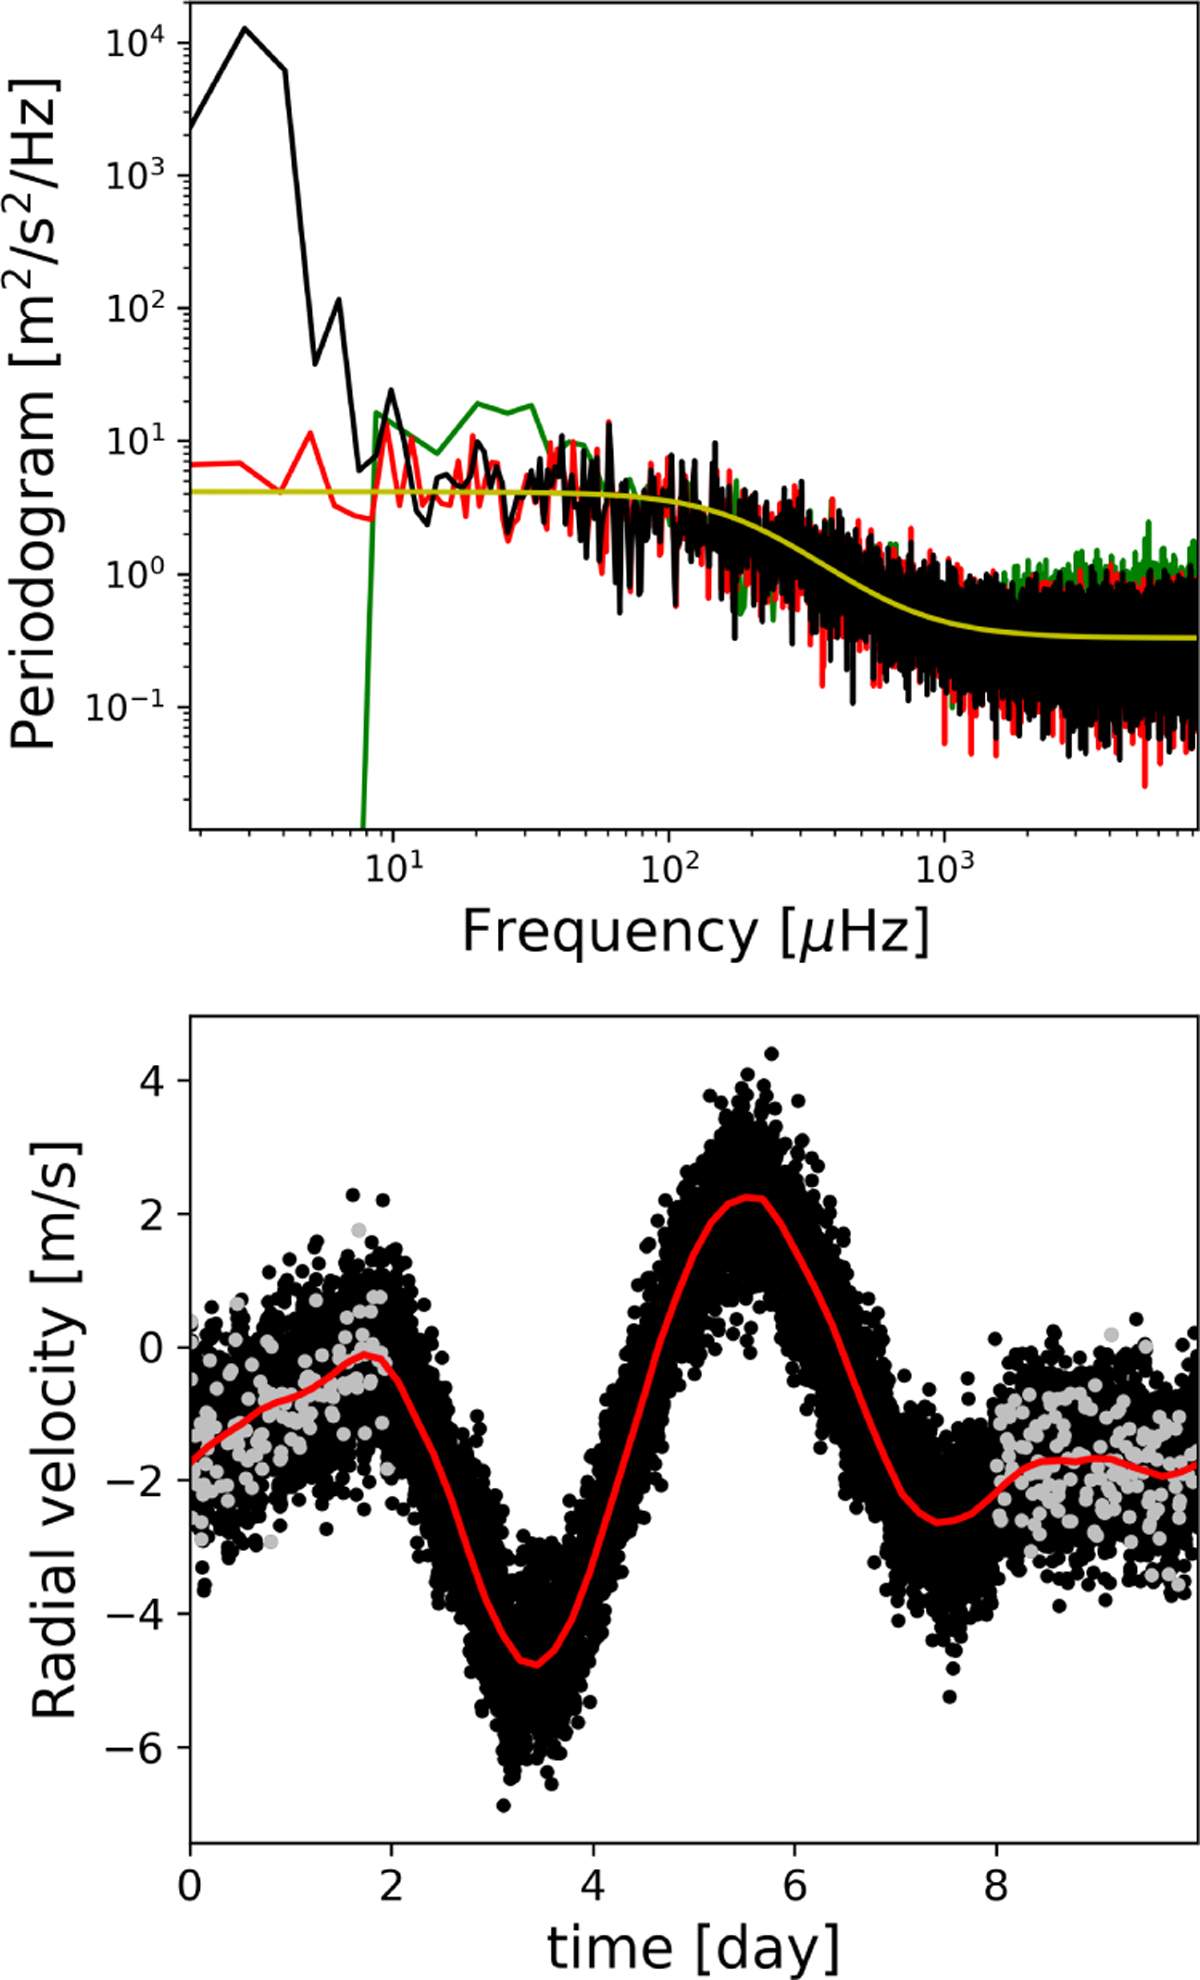
Example of the synthetic time series generated to validate the 3SD approach when noise equals magnetic activity plus long-term trends, granulation, and WGN. Top: averaged periodograms of the two-day GOLF solar observations used in Sect. 2.4 (green) and the associated MHD training data (red), Harvey model fit to the MHD PSD (yellow), and averaged periodogram of the final synthetic data (GP+Harvey, black). Bottom: example of synthetic RV data generated with a regular sampling (black) based on a GP noise modeling for the magnetic activity (red). For the study, the dataset was also sampled irregularly (gray).
Current usage metrics show cumulative count of Article Views (full-text article views including HTML views, PDF and ePub downloads, according to the available data) and Abstracts Views on Vision4Press platform.
Data correspond to usage on the plateform after 2015. The current usage metrics is available 48-96 hours after online publication and is updated daily on week days.
Initial download of the metrics may take a while.