Fig. 3
Download original image
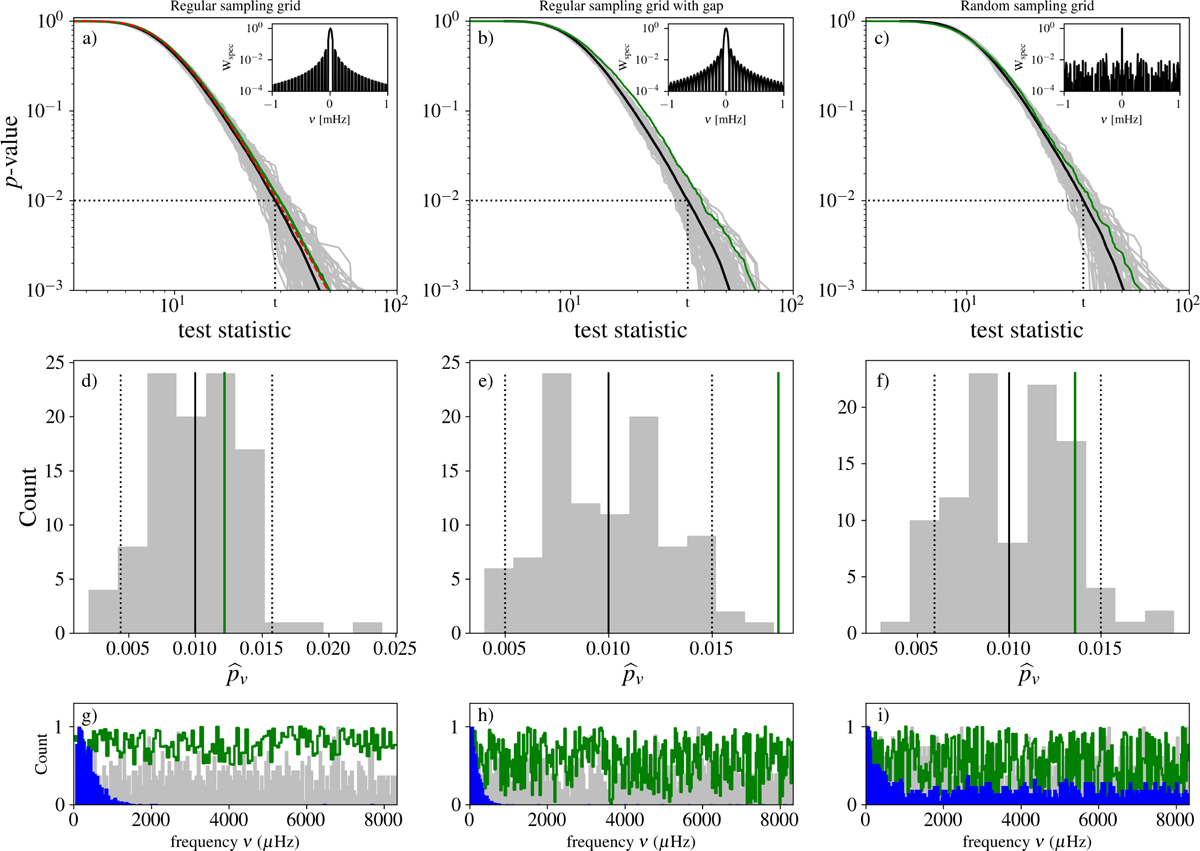
Validation of the 3SD approach for a noise n composed of granulation plus WGN and d = 0 in Eq. (1). We investigate three temporal sampling grids, from left to right: regular, regular with a central gap, and random. Top panels: relation pv(t) for the detection procedure using a genuine NTS based on GOLF solar data (green; oracle). The B = 100 estimates ![]() produced by the 3SD procedure using the MHD-based NTS (gray). Sample mean value
produced by the 3SD procedure using the MHD-based NTS (gray). Sample mean value ![]() of the gray curves (black). The spectral window of each sampling grid is shown in the inset panels. In panel (a), the red line represents the analytical expression of pv (see Eq. (13) of Sulis et al. 2020). The dotted lines indicate the test statistics for which
of the gray curves (black). The spectral window of each sampling grid is shown in the inset panels. In panel (a), the red line represents the analytical expression of pv (see Eq. (13) of Sulis et al. 2020). The dotted lines indicate the test statistics for which ![]() equals a mean p-value of 1%. Middle panels: empirical distribution of
equals a mean p-value of 1%. Middle panels: empirical distribution of ![]() at t and 90% intervals (dotted lines) around the mean (solid black lines). P-values obtained with the oracle are shown with green vertical lines. Bottom panels: for one of the B loops of algorithm 2, we show an example of the empirical distribution of the b = 104 random values of the frequency index where the largest periodogram peak was found (gray). Empirical distribution of the Max test related to the oracle procedure (green; only contours are shown for clarity). The same distribution, but for a nonstandardized LSP is shown in blue (i.e., the Max test is applied to p instead of
at t and 90% intervals (dotted lines) around the mean (solid black lines). P-values obtained with the oracle are shown with green vertical lines. Bottom panels: for one of the B loops of algorithm 2, we show an example of the empirical distribution of the b = 104 random values of the frequency index where the largest periodogram peak was found (gray). Empirical distribution of the Max test related to the oracle procedure (green; only contours are shown for clarity). The same distribution, but for a nonstandardized LSP is shown in blue (i.e., the Max test is applied to p instead of ![]() ).
).
Current usage metrics show cumulative count of Article Views (full-text article views including HTML views, PDF and ePub downloads, according to the available data) and Abstracts Views on Vision4Press platform.
Data correspond to usage on the plateform after 2015. The current usage metrics is available 48-96 hours after online publication and is updated daily on week days.
Initial download of the metrics may take a while.