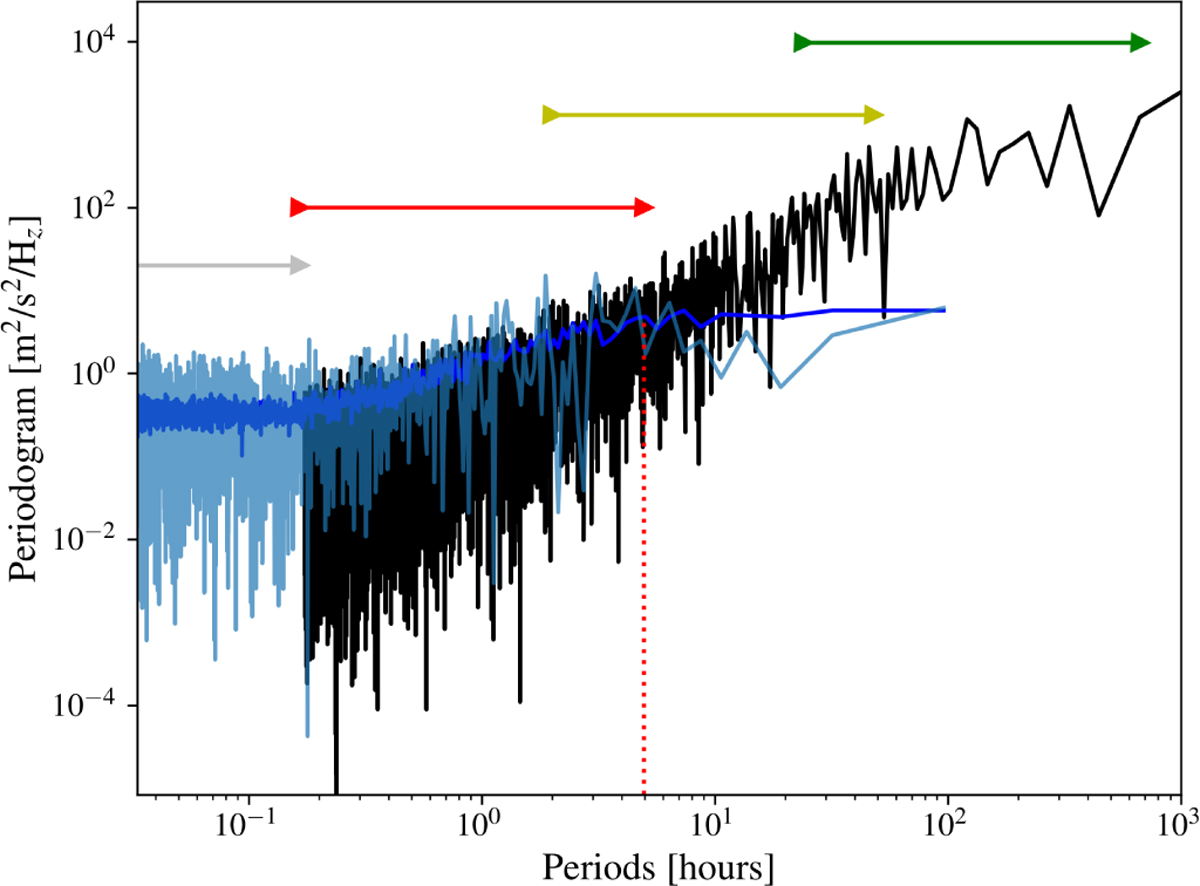
Fig. C.1
Download original image
PSD comparison of solar RVs taken with the HARPS-N telescope (black, 430 days) and synthetic RV extracted from 3D MHD simulations of solar granulation (light blue, 2 days). The averaged periodogram of the 26 MHD two-day time series is shown in dark blue. Period ranges dominates by high-frequency noise (instrumental and oscillations), granulation, supergranulation, and magnetic activity are indicated with gray, red, yellow, and green arrows. The dotted red vertical line indicates the period limit (~5 hours) within which the PSD is no longer dominated by the granulation noise.
Current usage metrics show cumulative count of Article Views (full-text article views including HTML views, PDF and ePub downloads, according to the available data) and Abstracts Views on Vision4Press platform.
Data correspond to usage on the plateform after 2015. The current usage metrics is available 48-96 hours after online publication and is updated daily on week days.
Initial download of the metrics may take a while.