Fig. 10
Download original image
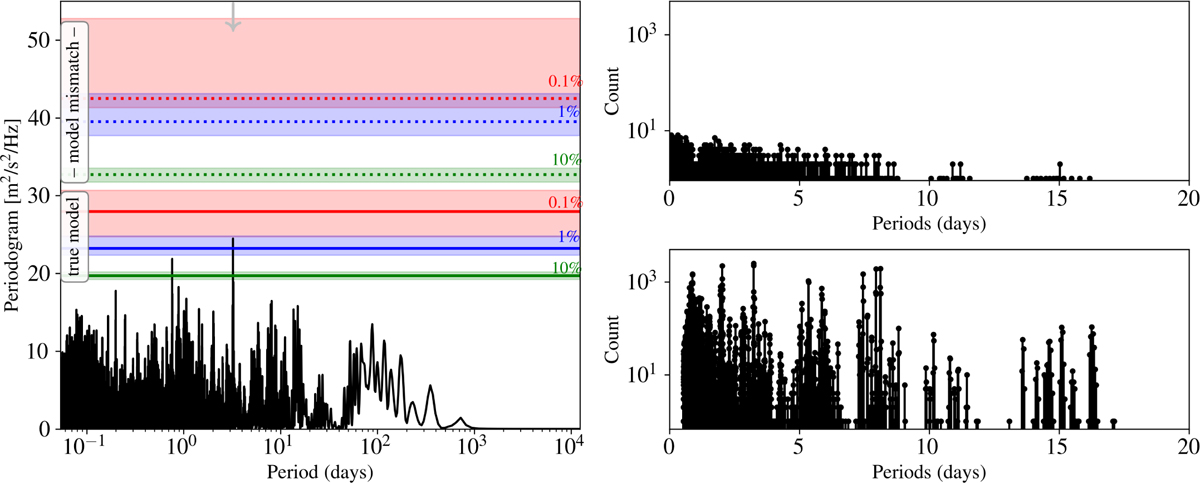
Impact of noise model errors on the significance levels. Left: Lomb–Scargle periodogram of the α CenB RV residuals. The peak at 3.2 days is shown by the gray vertical arrow. Solid lines are the mean p-values estimated without a model error. The p-value at t: = p(3.2 d) = 24.48 is within the 90% interval [0.1%, 0.7%]. Dotted lines are the mean p-values estimated with a model error (see text). The p-value at t = 24.48 this time is within the 90% interval [59.5%, 64.7%]. Right: distribution of the period index where the maximum periodogram value was found in row 15 of algorithm 2 (zoom at periods <20 days). The standard version of the 3SD procedure (simulating the situation without a model error) is shown in the top panel, and the hybrid version (detection process run with a model error) is shown in the bottom panel. A bias toward specific periods is visible in the bottom panel: the model error leaves residuals in which periodicities are imprinted.
Current usage metrics show cumulative count of Article Views (full-text article views including HTML views, PDF and ePub downloads, according to the available data) and Abstracts Views on Vision4Press platform.
Data correspond to usage on the plateform after 2015. The current usage metrics is available 48-96 hours after online publication and is updated daily on week days.
Initial download of the metrics may take a while.