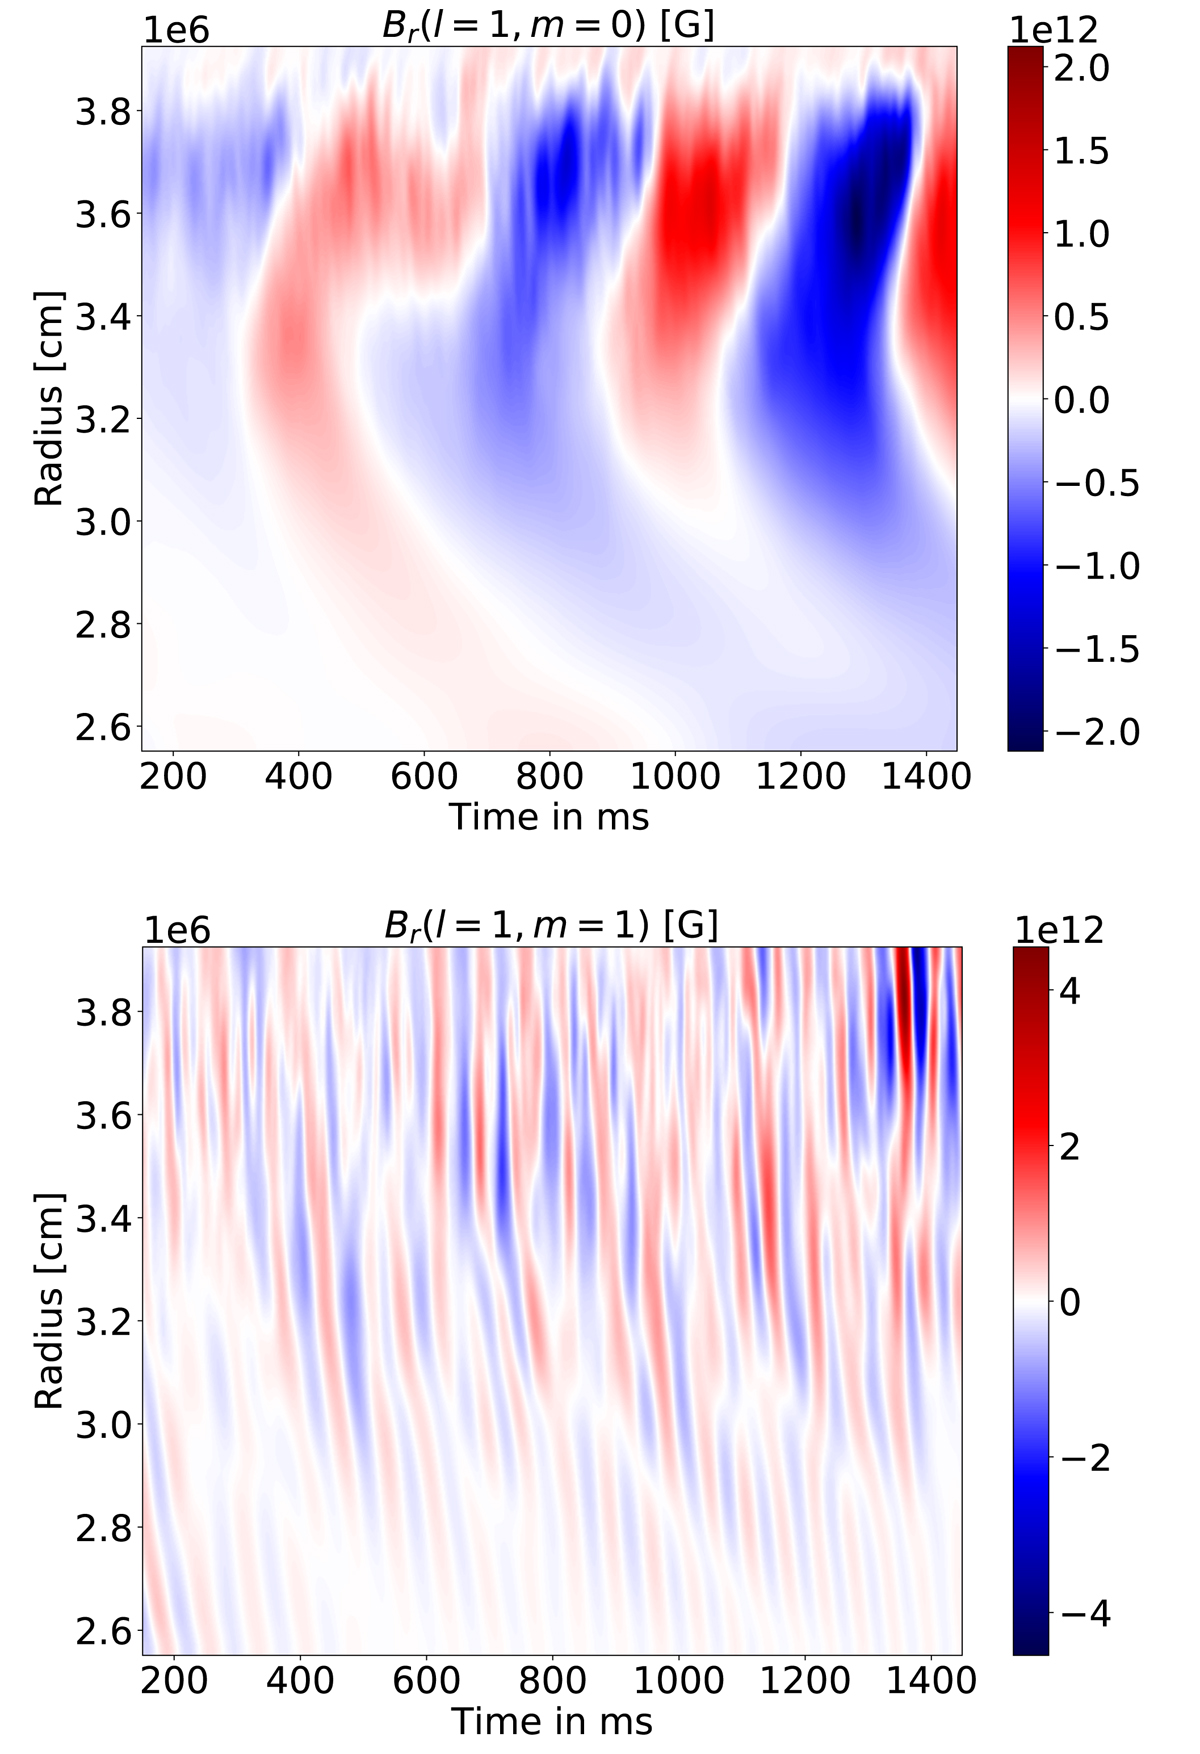
Fig. 8.
Download original image
Radius-time diagram of the dipolar modes. Top: radius-time diagram of the axial dipolar mode Br(l = 1, m = 0). The period of the dipole reversal is Pdip ≃ 410 ms. Bottom: radius-time diagram of the equatorial dipolar mode amplitude Br(l = 1, m = 1) at a given azimuth ϕ = 0 in the rotating frame of the simulation. The fast oscillations are due to the rotation of this dipole mode.
Current usage metrics show cumulative count of Article Views (full-text article views including HTML views, PDF and ePub downloads, according to the available data) and Abstracts Views on Vision4Press platform.
Data correspond to usage on the plateform after 2015. The current usage metrics is available 48-96 hours after online publication and is updated daily on week days.
Initial download of the metrics may take a while.