Open Access
Fig. 1.
Download original image
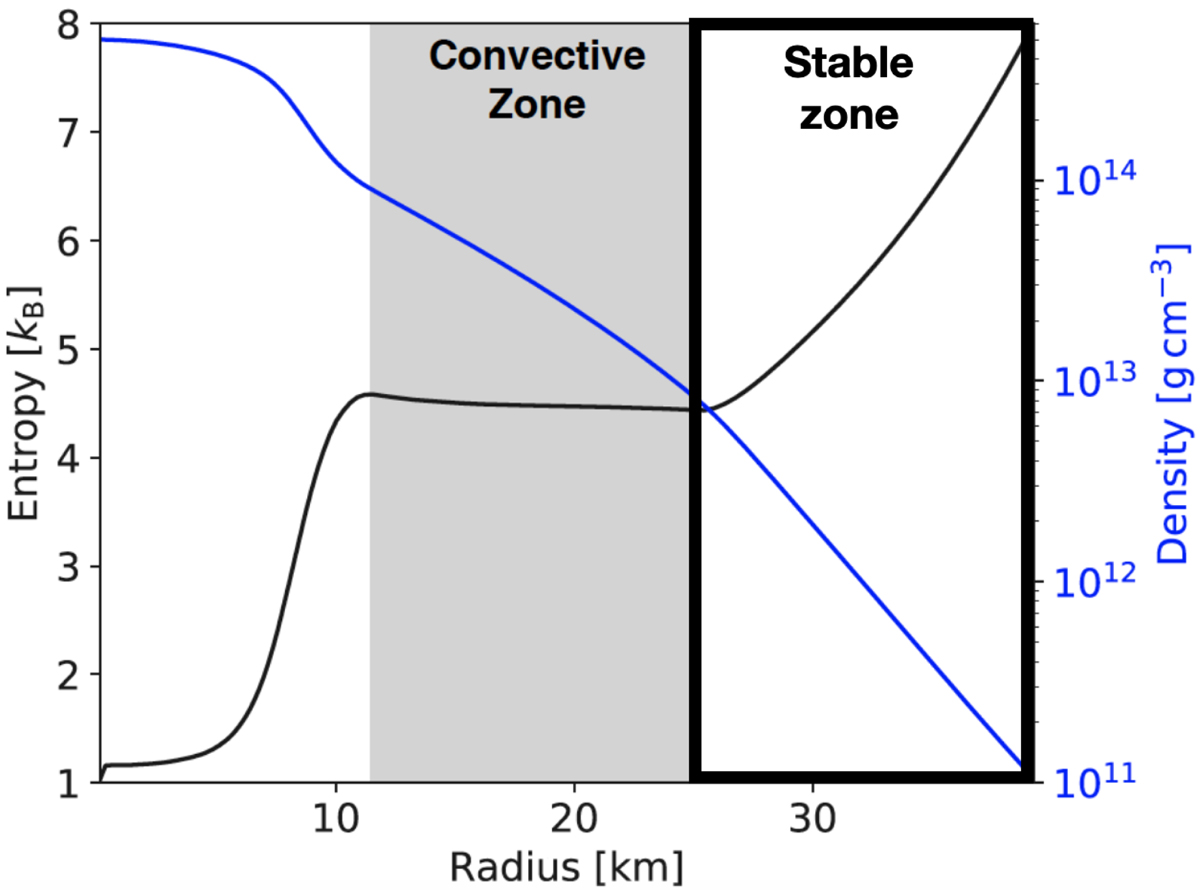
1D radial profiles of the entropy per baryon (black line) and density (blue line) of our PNS model at t = 0.2 s post-bounce. Our simulation domain corresponds to the outer stably stratified layer delimited by the thick black line.
Current usage metrics show cumulative count of Article Views (full-text article views including HTML views, PDF and ePub downloads, according to the available data) and Abstracts Views on Vision4Press platform.
Data correspond to usage on the plateform after 2015. The current usage metrics is available 48-96 hours after online publication and is updated daily on week days.
Initial download of the metrics may take a while.