Fig. 7
Download original image
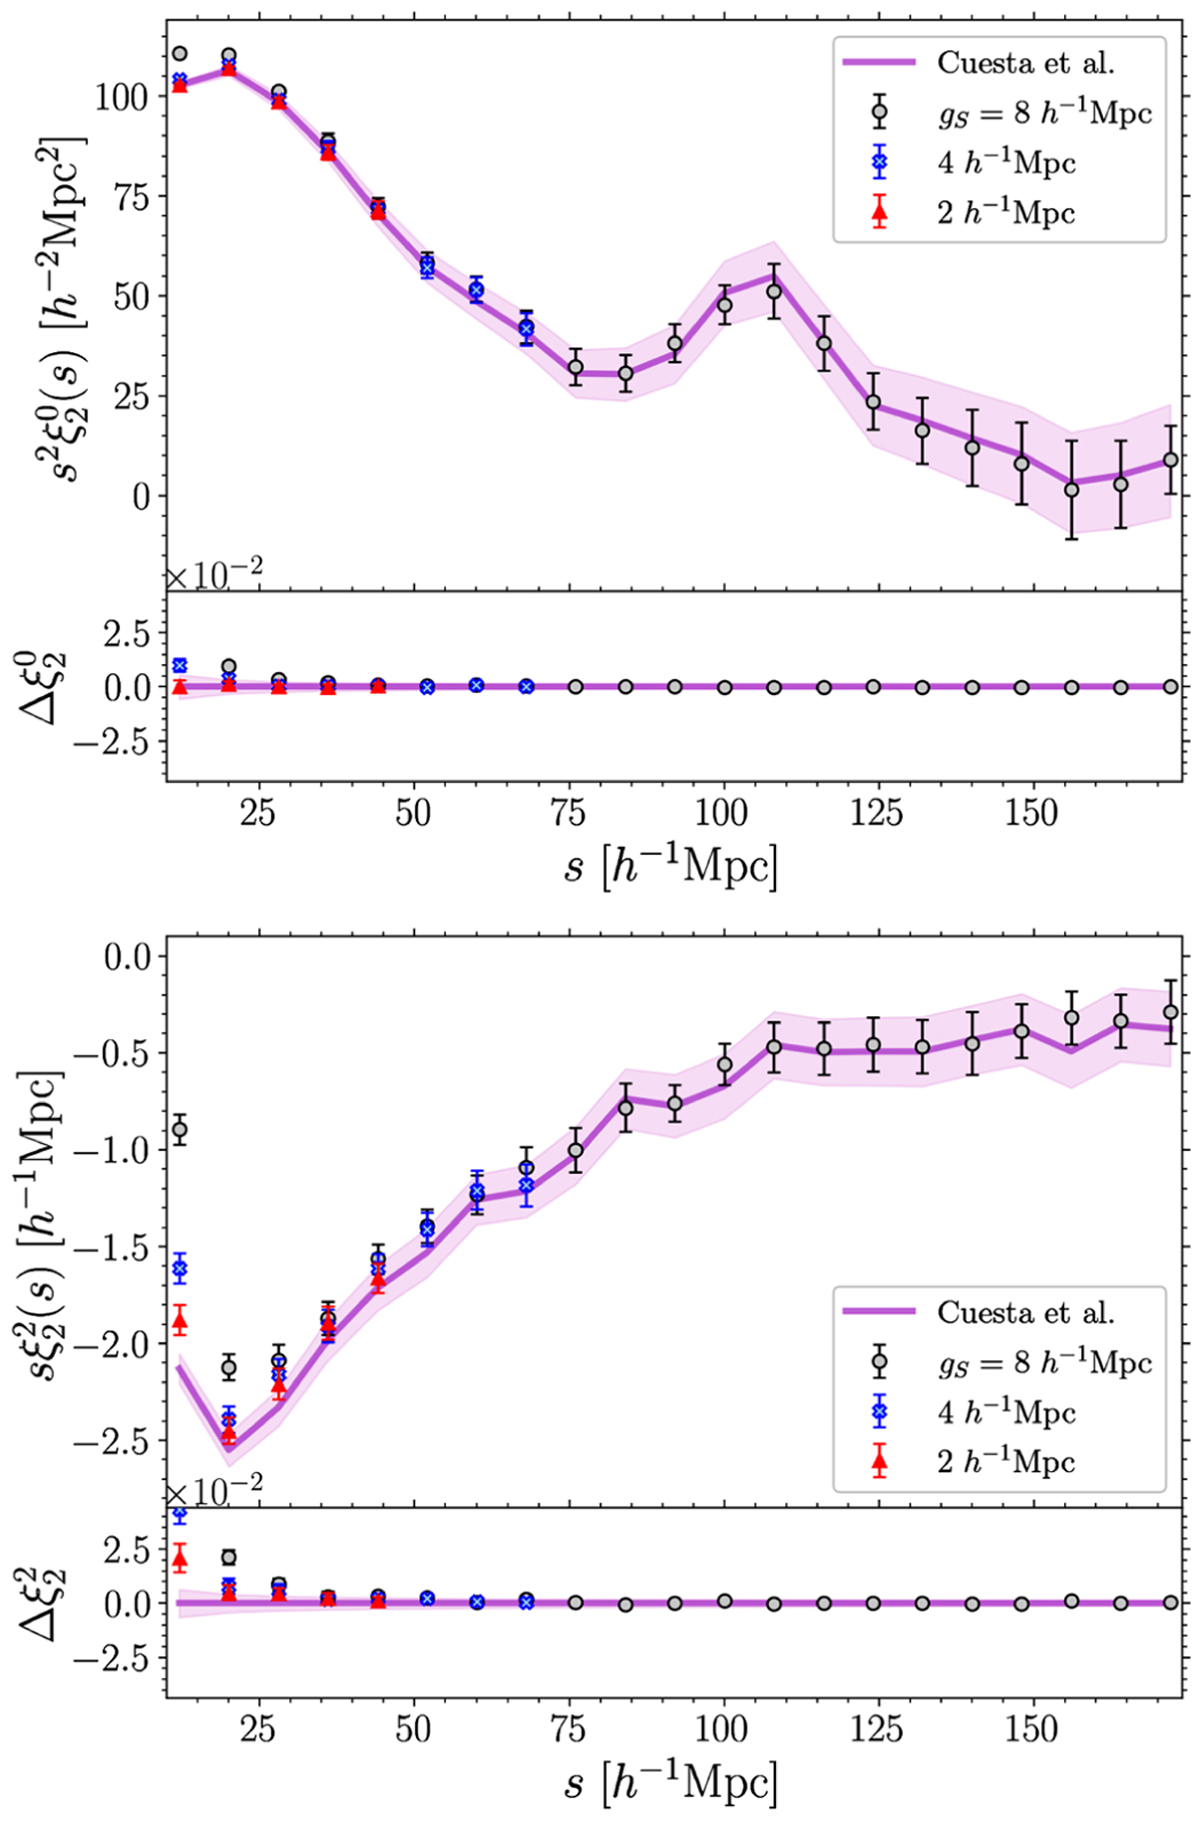
A comparison of the 2pcf as measured by the ConKer algorithm versus existing clustering algorithms. Top: 2pcf monopole ![]() computed using ConKer with three different values of grid spacing gS = 8 (grey), 4 (blue), 2 (red) h−1 Mpc, and results from Cuesta et al. (2016) (purple line). Finer grids were resampled to ∆s = 8 h−1 Mpc bins. The error bars on the ConKer points were extracted from the covariance matrix of the Patchy mock ensemble. The errors in Cuesta et al. (2016; shaded region) are from an ensemble of quick particle mesh mocks (White et al. 2014). The 2pcf is multiplied by s2 to emphasize features at large scales. The lower subpanel shows the residual between the two methods. Bottom: same as the top panel, but for the 2pcf quadrupole
computed using ConKer with three different values of grid spacing gS = 8 (grey), 4 (blue), 2 (red) h−1 Mpc, and results from Cuesta et al. (2016) (purple line). Finer grids were resampled to ∆s = 8 h−1 Mpc bins. The error bars on the ConKer points were extracted from the covariance matrix of the Patchy mock ensemble. The errors in Cuesta et al. (2016; shaded region) are from an ensemble of quick particle mesh mocks (White et al. 2014). The 2pcf is multiplied by s2 to emphasize features at large scales. The lower subpanel shows the residual between the two methods. Bottom: same as the top panel, but for the 2pcf quadrupole ![]() . Here, the 2pcf is multiplied by s instead of s2 by convention.
. Here, the 2pcf is multiplied by s instead of s2 by convention.
Current usage metrics show cumulative count of Article Views (full-text article views including HTML views, PDF and ePub downloads, according to the available data) and Abstracts Views on Vision4Press platform.
Data correspond to usage on the plateform after 2015. The current usage metrics is available 48-96 hours after online publication and is updated daily on week days.
Initial download of the metrics may take a while.