Fig. 11
Download original image
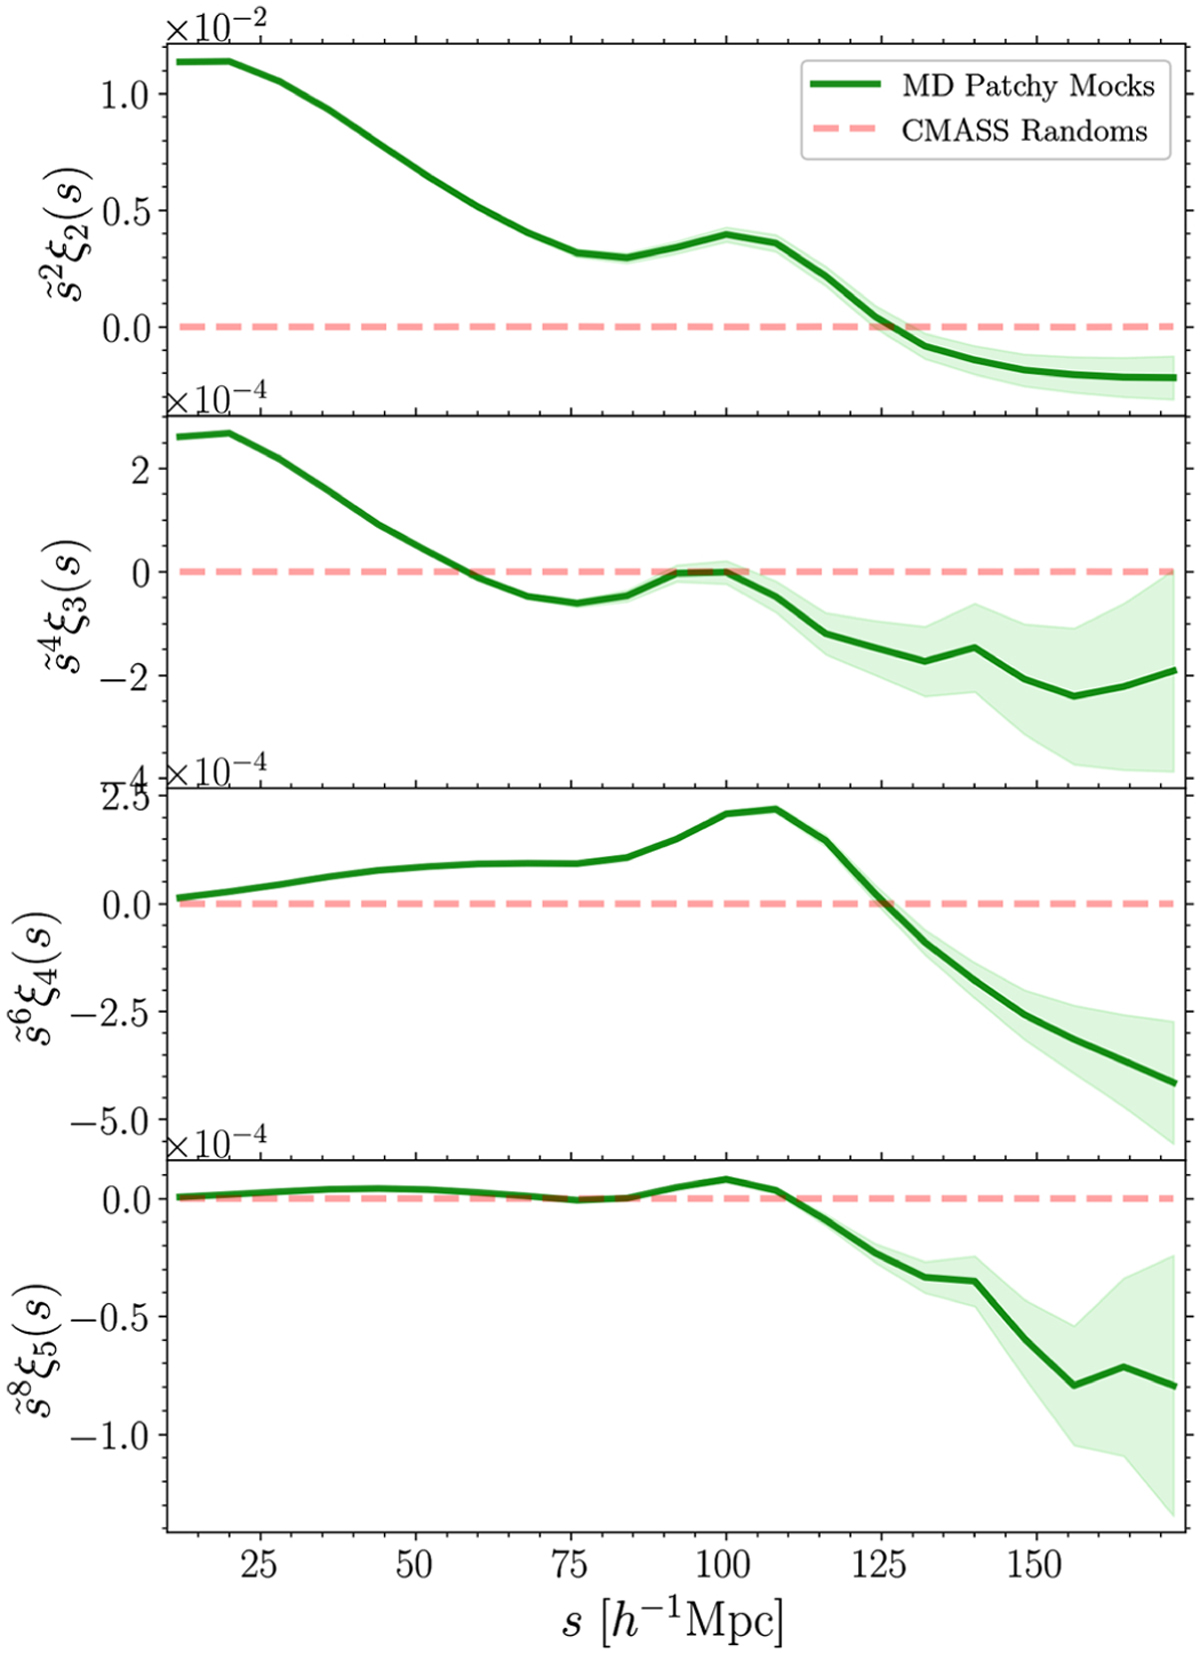
Diagonal npcf, ξn(s), from n = 2 to n = 5 (from top to bottom), for the combined SGC+NGC sample of the ensemble of MD Patchy mocks (green) and the associated randoms (red dashed line). The shaded green region around the mock average gives the errors computed from the diagonal elements of the mock co-variance matrix, C. The npcf is multiplied by a proxy for the total kernel volume, where ![]() . This convention highlights features at large scales.
. This convention highlights features at large scales.
Current usage metrics show cumulative count of Article Views (full-text article views including HTML views, PDF and ePub downloads, according to the available data) and Abstracts Views on Vision4Press platform.
Data correspond to usage on the plateform after 2015. The current usage metrics is available 48-96 hours after online publication and is updated daily on week days.
Initial download of the metrics may take a while.