Fig. 10
Download original image
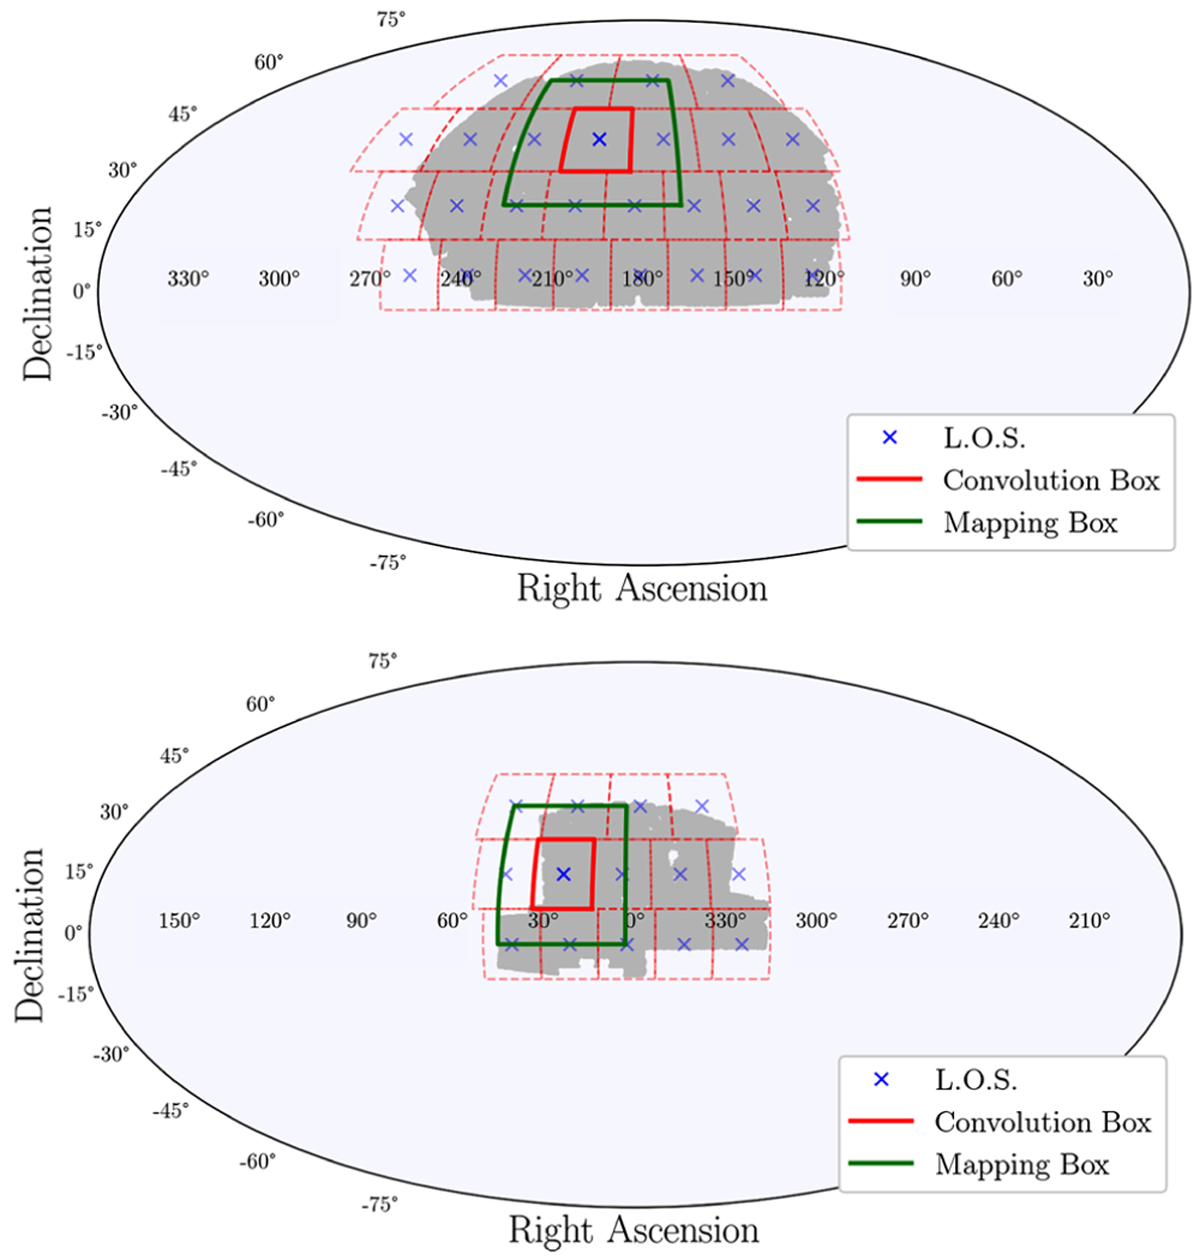
Angular footprint of the NGC (top) and SGC (bottom) galaxies (grey dots), divided into partitions (dashed red lines), each with a unique LOS (blue marker). The solid red line highlights one such partition. During the convolution step, the center of the kernel is positioned within these boundaries, while the convolution is performed over the region bound by the solid green line.
Current usage metrics show cumulative count of Article Views (full-text article views including HTML views, PDF and ePub downloads, according to the available data) and Abstracts Views on Vision4Press platform.
Data correspond to usage on the plateform after 2015. The current usage metrics is available 48-96 hours after online publication and is updated daily on week days.
Initial download of the metrics may take a while.