Fig. 4.
Download original image
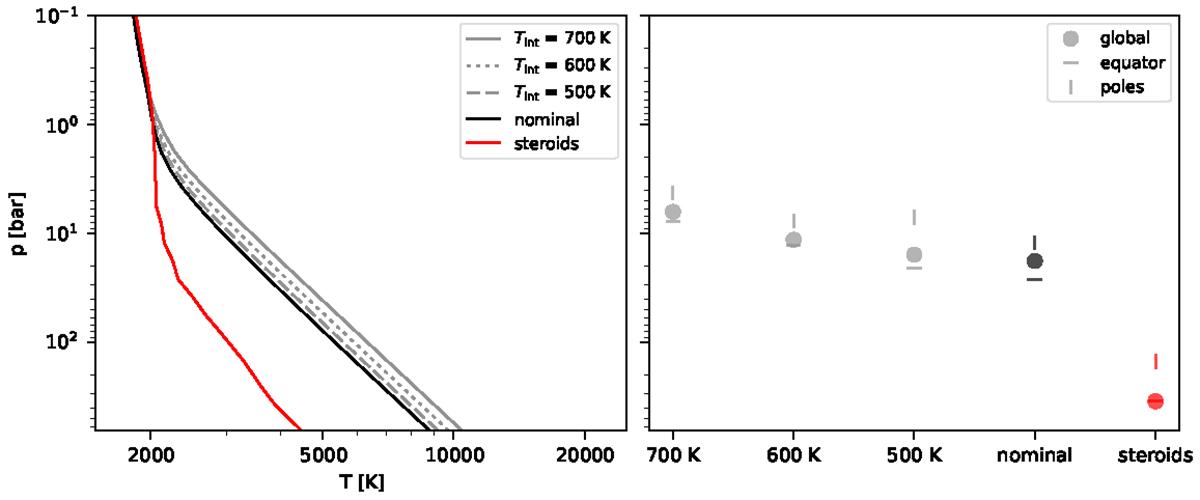
Temperature profiles and RCB locations. Left: temperature profiles for different intrinsic temperatures (gray) and final temperature profiles of the nominal (Tint ≈ 434 K) and steroids simulation. Right: calculated RCB for the different temperature profiles of the left panel. Additional markers display the RCB calculated for the equatorial and the polar region. The gray profiles are calculated from the temperature evolution of the nominal model. We note that the steroids model loses energy due to dissipation and therefore has no physical intrinsic temperature.
Current usage metrics show cumulative count of Article Views (full-text article views including HTML views, PDF and ePub downloads, according to the available data) and Abstracts Views on Vision4Press platform.
Data correspond to usage on the plateform after 2015. The current usage metrics is available 48-96 hours after online publication and is updated daily on week days.
Initial download of the metrics may take a while.