Open Access
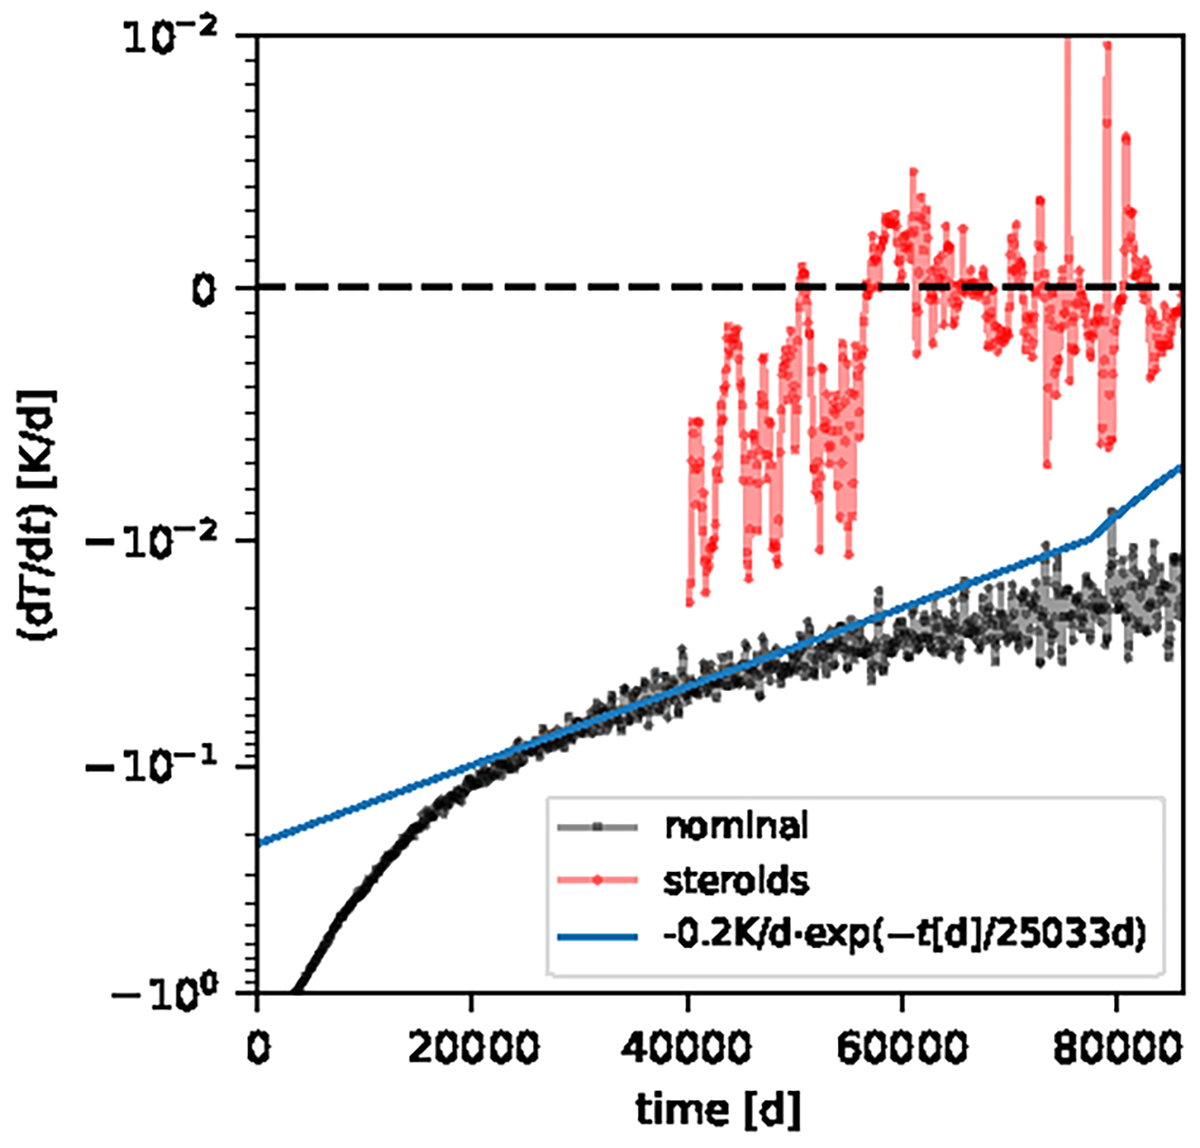
Fig. 3.
Download original image
Evolution of the rate of temperature change at 650 bar with time of the nominal (black) and the steroids (red) model. We note that the y-axis is linear between −0.01 and 0.01 and logarithmic elsewhere. The fit on the rate of temperature change by an exponential decay around t = 40 000 d is shown in blue.
Current usage metrics show cumulative count of Article Views (full-text article views including HTML views, PDF and ePub downloads, according to the available data) and Abstracts Views on Vision4Press platform.
Data correspond to usage on the plateform after 2015. The current usage metrics is available 48-96 hours after online publication and is updated daily on week days.
Initial download of the metrics may take a while.