Fig. 3
Download original image
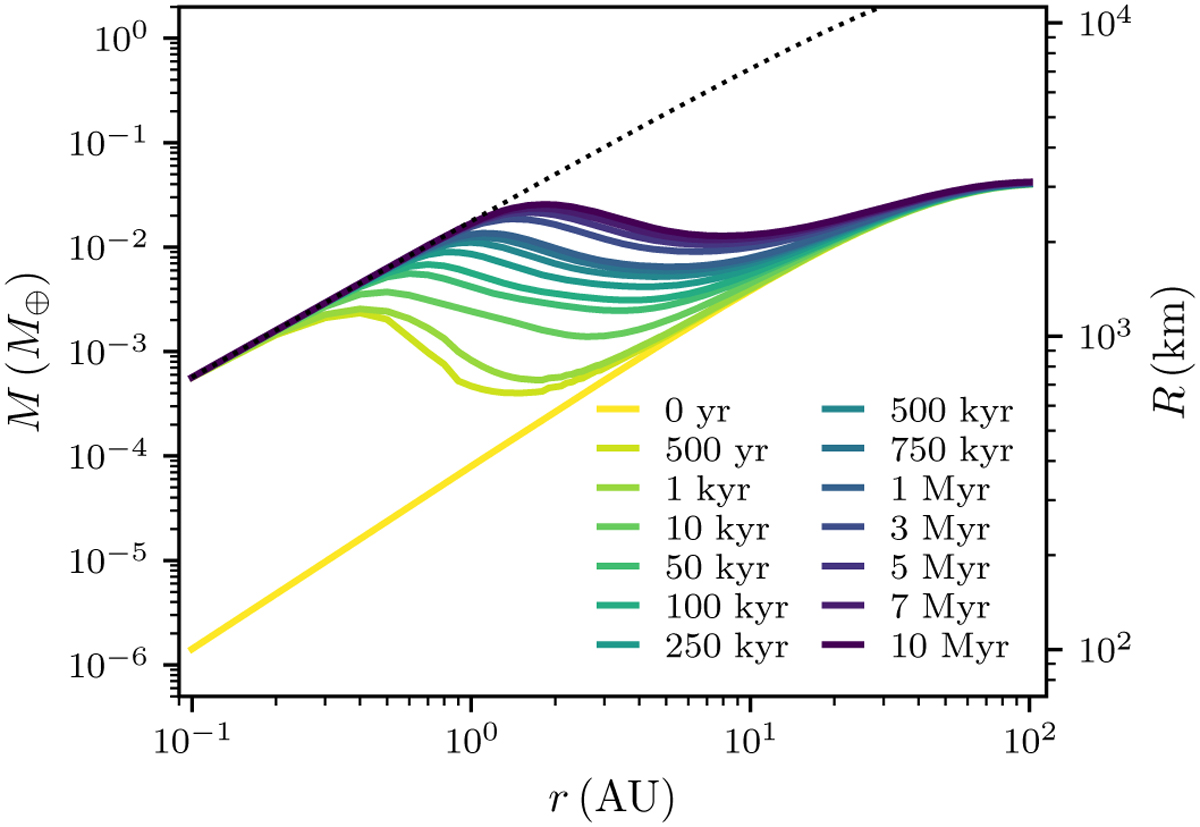
Embryo mass at different distances for different time snapshots around a 1 M⊙ star. The embryo mass is shown for different times (relative to t0) as coloured lines. Accretion efficiency decreases with increasing distance and almost ceases outside of ~20 AU. The maximum mass Mfil that an embryo can reach (dotted black line) is over-plotted.
Current usage metrics show cumulative count of Article Views (full-text article views including HTML views, PDF and ePub downloads, according to the available data) and Abstracts Views on Vision4Press platform.
Data correspond to usage on the plateform after 2015. The current usage metrics is available 48-96 hours after online publication and is updated daily on week days.
Initial download of the metrics may take a while.