Fig. 11
Download original image
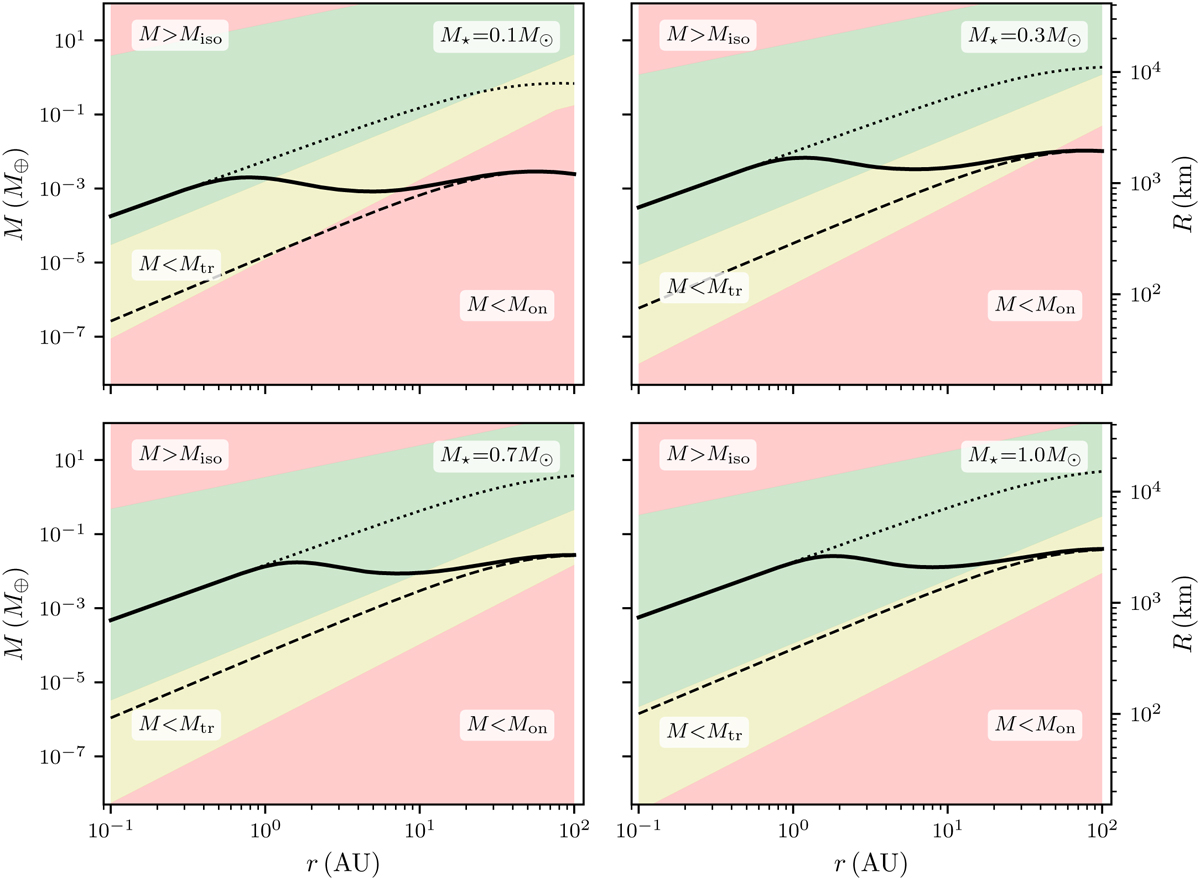
Mapping final regimes of embryo masses to pebble accretion. The figure shows the masses of the embryos at 10 Myr for four different stellar masses as a function of distance. The initial masses (dashed lines) and the filament masses (dotted lines) are shown for comparison. Where the mass is below the onset mass Mon (Eq. (24)) or above the pebble isolation mass Miso (Eq. (26)), pebble accretion would be absent (red area). Above the onset mass but below the transition mass Mtr (Eq. (25)), embryos would accrete pebbles on the Bondi branch (yellow area). Efficient pebble accretion would be possible for embryo masses above Mtr (green).
Current usage metrics show cumulative count of Article Views (full-text article views including HTML views, PDF and ePub downloads, according to the available data) and Abstracts Views on Vision4Press platform.
Data correspond to usage on the plateform after 2015. The current usage metrics is available 48-96 hours after online publication and is updated daily on week days.
Initial download of the metrics may take a while.