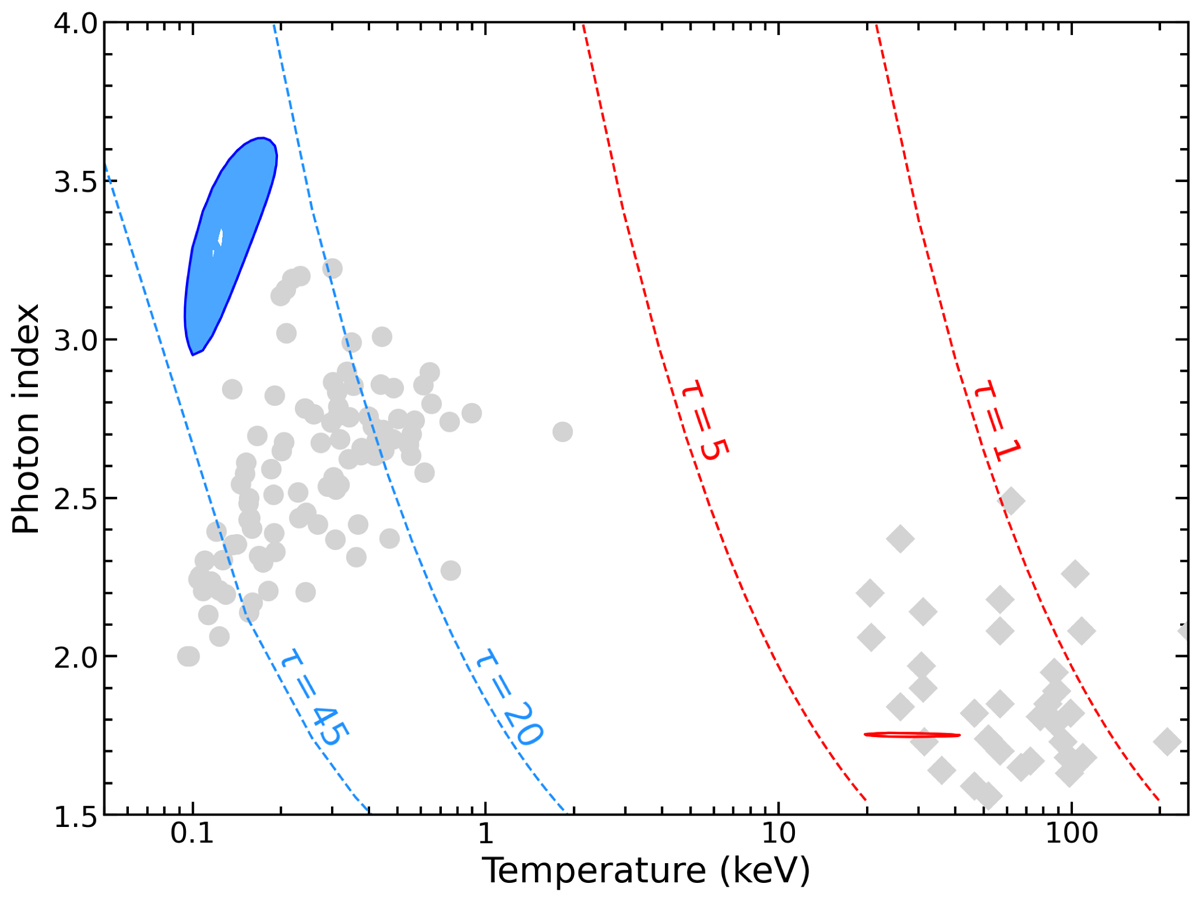
Fig. 8.
Download original image
Contour plots obtained with two NTHCOMP components for the warm and hot coronae are shown in blue and red, respectively. Shaded regions indicate 68% confidence levels. Dashed red and blue lines indicate different Thomson optical depths obtained with the formula (A1) in Zdziarski et al. (1996). Gray circles and diamonds are data points reported in Petrucci et al. (2018) for their sample of 22 sources.
Current usage metrics show cumulative count of Article Views (full-text article views including HTML views, PDF and ePub downloads, according to the available data) and Abstracts Views on Vision4Press platform.
Data correspond to usage on the plateform after 2015. The current usage metrics is available 48-96 hours after online publication and is updated daily on week days.
Initial download of the metrics may take a while.