Open Access
Fig. 7.
Download original image
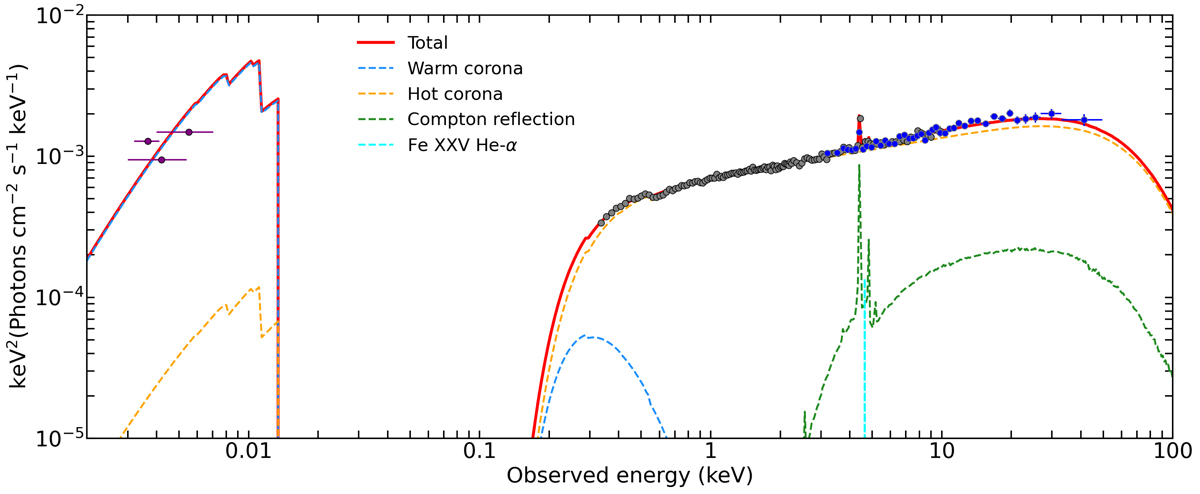
The total best fitting model is shown as a red solid line and UV/X-ray data are superimposed. The four spectral components are labeled and shown as dashed lines. XMM-Newton OM data are plotted in purple, pn data in grey and NuSTAR grouped FPMA/B data in blue. Data have been rebinned in energy for the sake of visual clarity.
Current usage metrics show cumulative count of Article Views (full-text article views including HTML views, PDF and ePub downloads, according to the available data) and Abstracts Views on Vision4Press platform.
Data correspond to usage on the plateform after 2015. The current usage metrics is available 48-96 hours after online publication and is updated daily on week days.
Initial download of the metrics may take a while.