Open Access
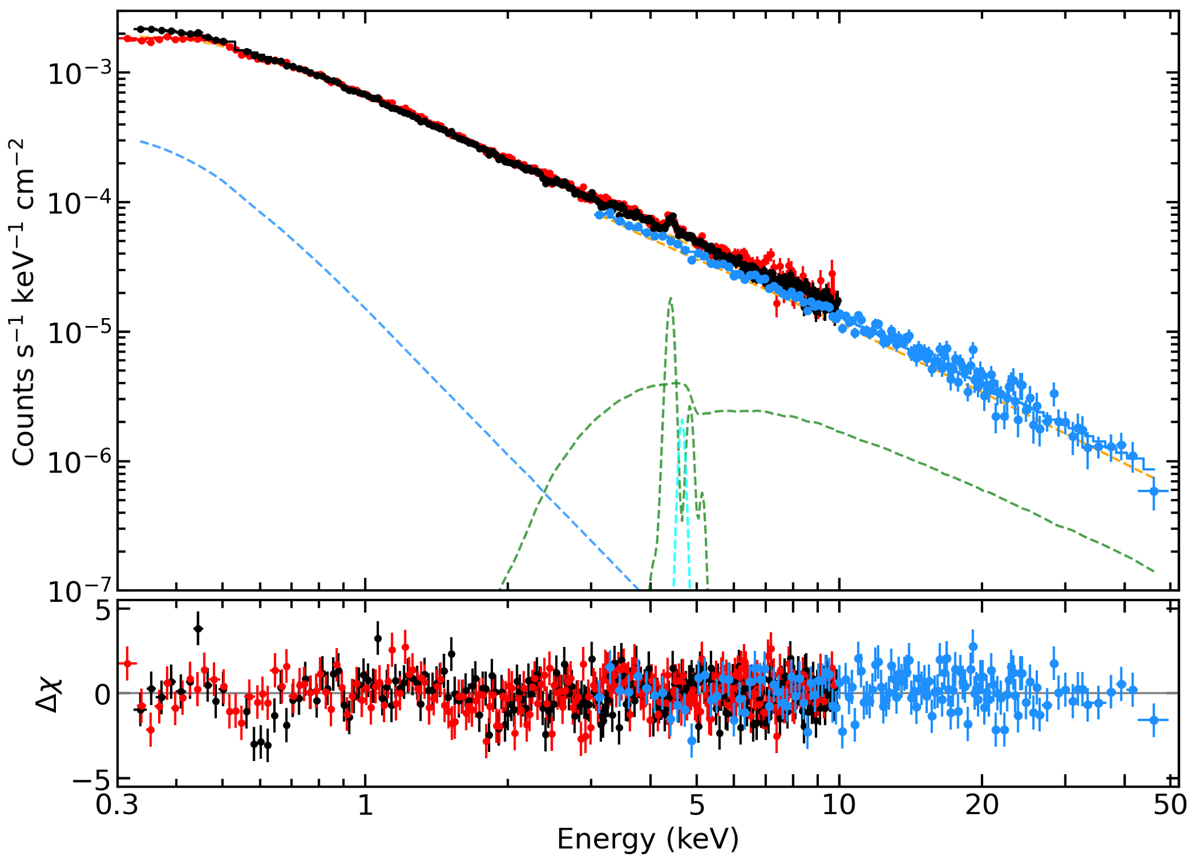
Fig. 5.
Download original image
Best-fit model, data, and residuals with the BORUS model; see text for details. Color coding for the different instruments follows the same scheme used in Fig. 1.
Current usage metrics show cumulative count of Article Views (full-text article views including HTML views, PDF and ePub downloads, according to the available data) and Abstracts Views on Vision4Press platform.
Data correspond to usage on the plateform after 2015. The current usage metrics is available 48-96 hours after online publication and is updated daily on week days.
Initial download of the metrics may take a while.