Open Access
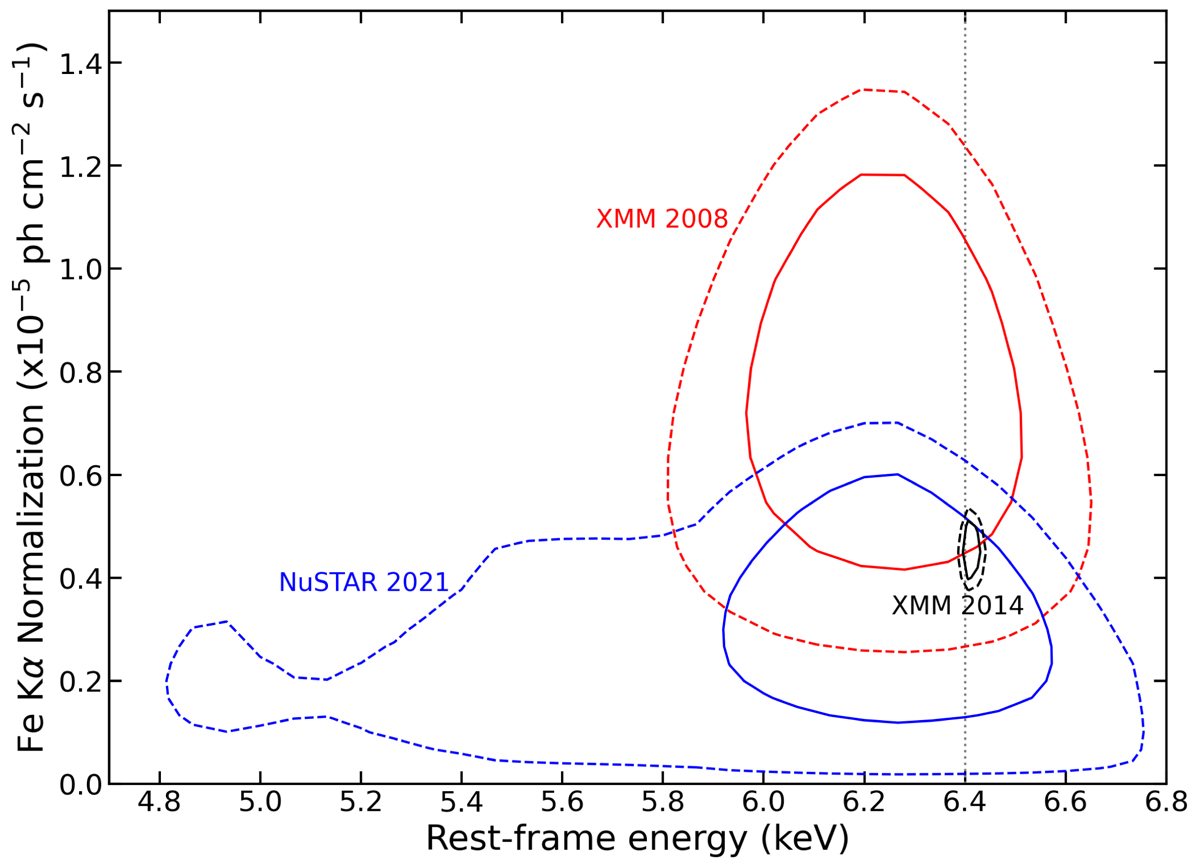
Fig. 3.
Download original image
Contour plots between the energy centroid and normalization of the Fe Kα emission line, for the three epochs. Solid and dashed lines indicate 68% and 90% confidence level contours, respectively.
Current usage metrics show cumulative count of Article Views (full-text article views including HTML views, PDF and ePub downloads, according to the available data) and Abstracts Views on Vision4Press platform.
Data correspond to usage on the plateform after 2015. The current usage metrics is available 48-96 hours after online publication and is updated daily on week days.
Initial download of the metrics may take a while.