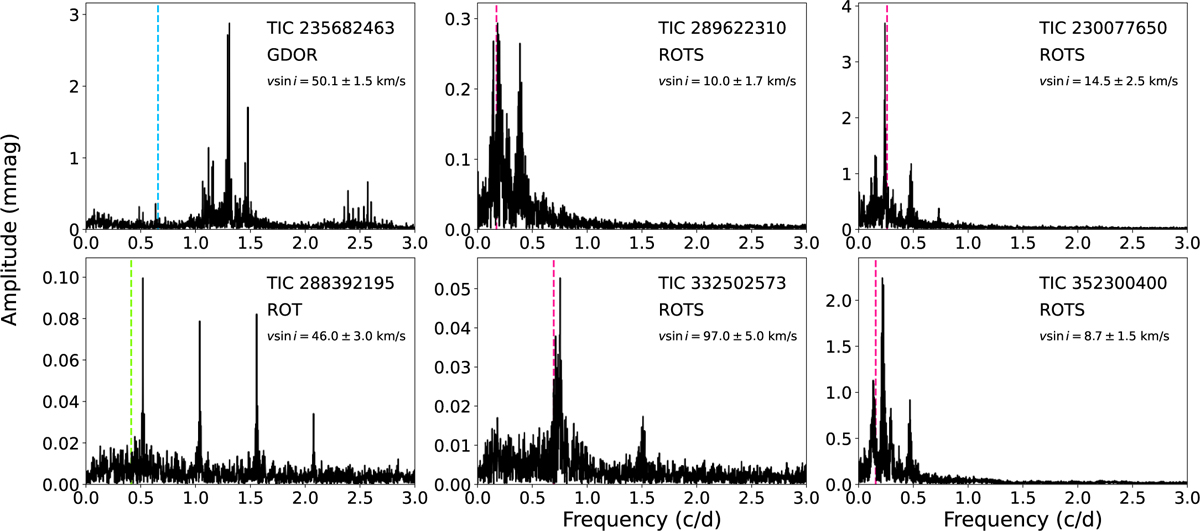
Fig. 8
Download original image
Examples of FTs of GDOR (top left panel), ROT (bottom left panel), and ROTS stars (middle and right panels), showing also the position of frequencies calculated from observed ν sin i and catalogue radii of the stars (vertical colour lines). It is apparent that the calculated frequency corresponds well with the observed peaks in the FT of ROTS stars.
Current usage metrics show cumulative count of Article Views (full-text article views including HTML views, PDF and ePub downloads, according to the available data) and Abstracts Views on Vision4Press platform.
Data correspond to usage on the plateform after 2015. The current usage metrics is available 48-96 hours after online publication and is updated daily on week days.
Initial download of the metrics may take a while.