Fig. 6
Download original image
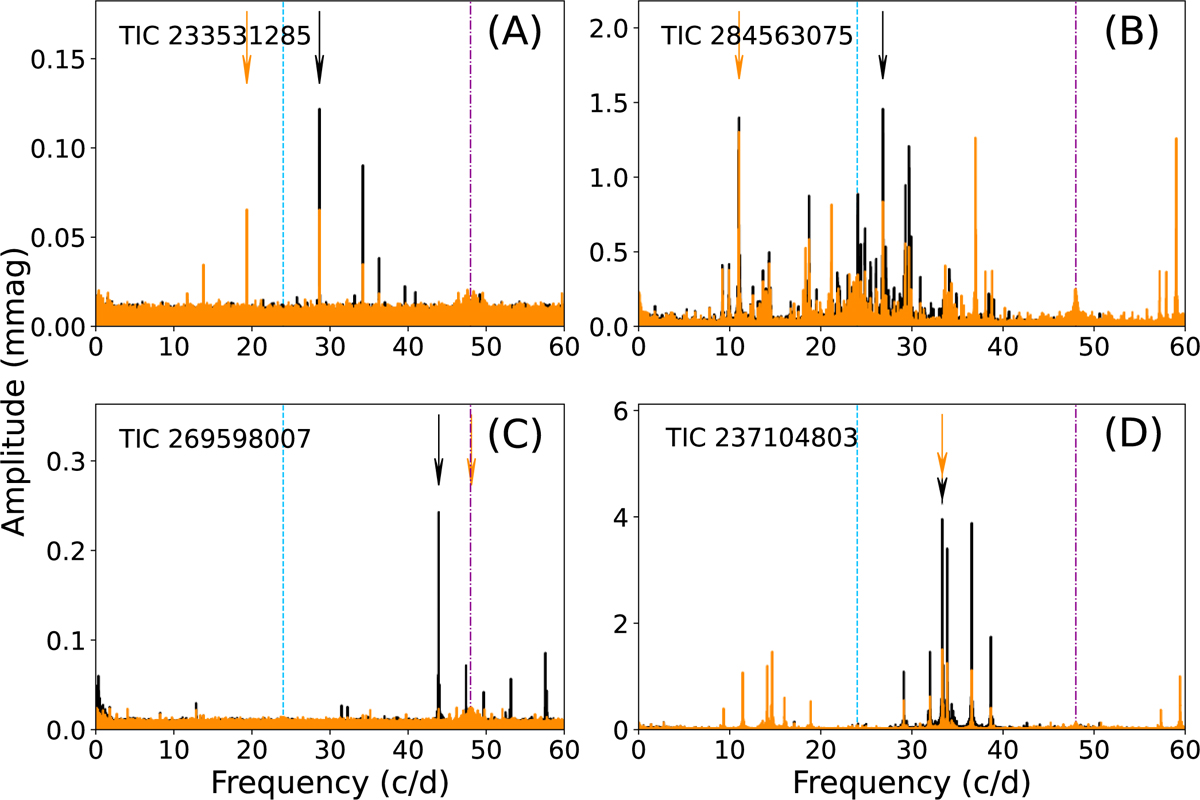
Comparison of the FT based on the LC (orange) and SC (black) data for four DSCT stars. Frequencies with the highest amplitudes in the LC and SC data are marked with arrows of corresponding colour. The Nyquist frequency and its harmonic at 2ƒNyquist are shown with the vertical light blue and magenta lines, respectively. Panel A shows the example when the Nyquist reflection of the highest peak would be detected in LC data, panel Β shows the situation when the peak with the second highest amplitude would be the highest in the LC data, and panel C illustrates a situation when almost no variation is seen in the LC data and the identification completely failed in LC data. Panel D shows an example of when the proper peak would also be identified in LC data.
Current usage metrics show cumulative count of Article Views (full-text article views including HTML views, PDF and ePub downloads, according to the available data) and Abstracts Views on Vision4Press platform.
Data correspond to usage on the plateform after 2015. The current usage metrics is available 48-96 hours after online publication and is updated daily on week days.
Initial download of the metrics may take a while.