Open Access
Fig. 5
Download original image
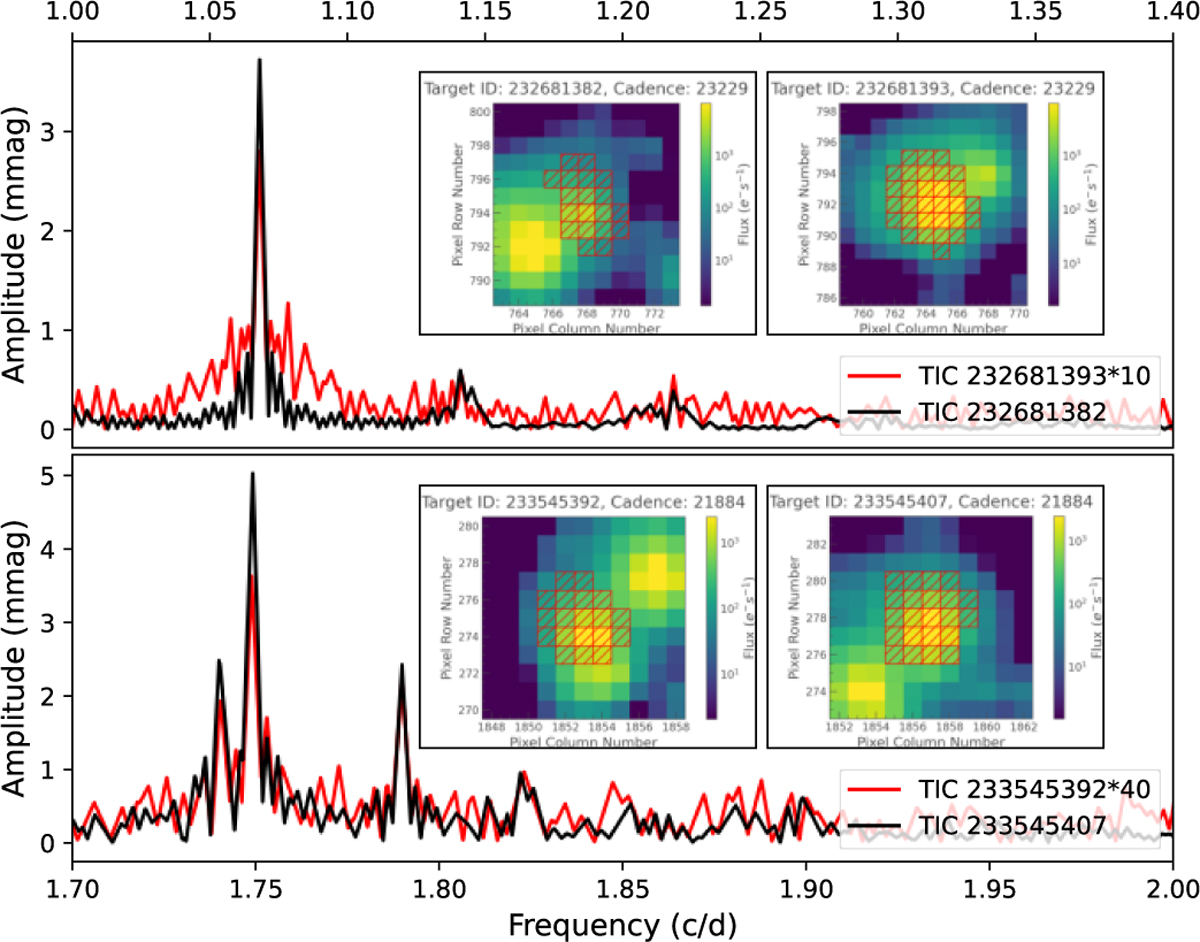
Frequency spectra of two couples of blending stars. The apertures are shown in the insets. The red spectra correspond to non-variable stars contaminated by the nearby variables. The amplitudes of the peaks of non-variable blends are multiplied for a better visibility, by 10 and 40.
Current usage metrics show cumulative count of Article Views (full-text article views including HTML views, PDF and ePub downloads, according to the available data) and Abstracts Views on Vision4Press platform.
Data correspond to usage on the plateform after 2015. The current usage metrics is available 48-96 hours after online publication and is updated daily on week days.
Initial download of the metrics may take a while.