Fig. 4
Download original image
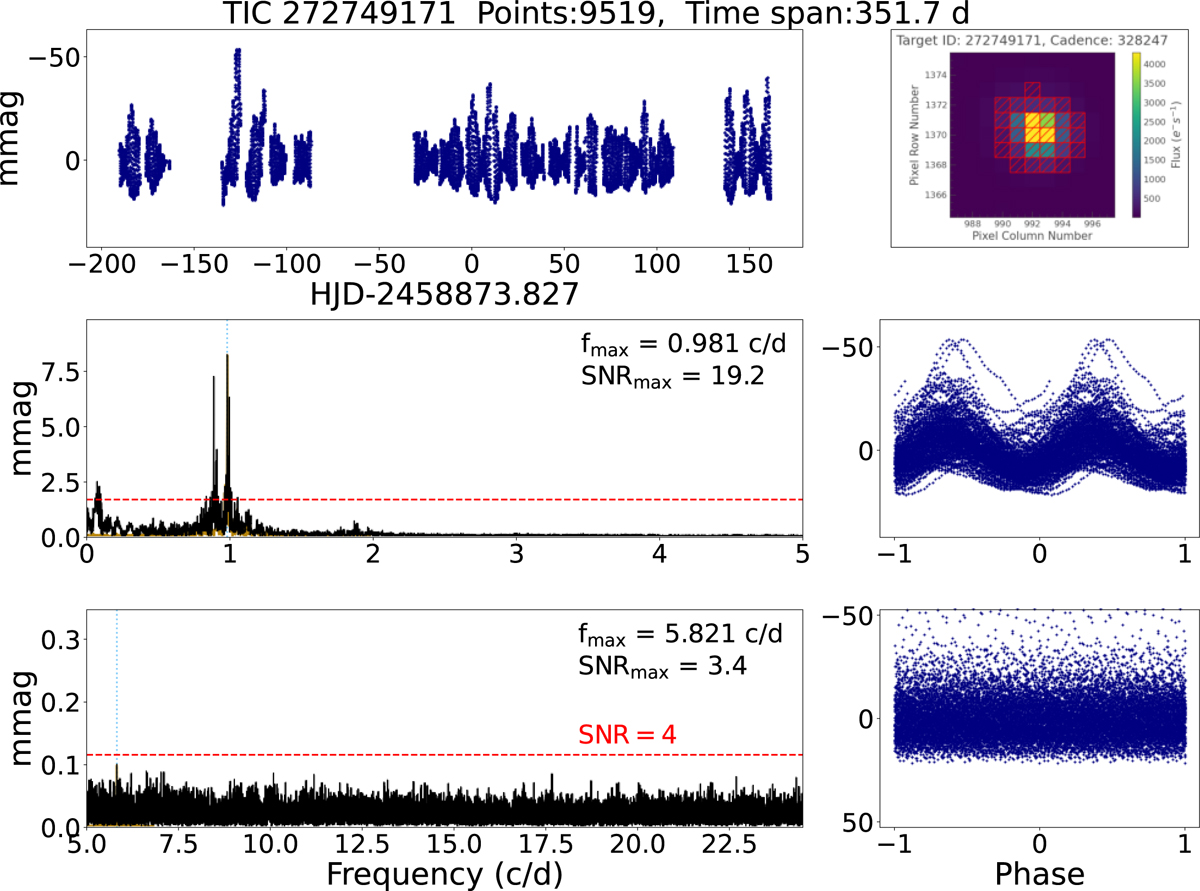
Example of the figures that have been produced and used for the basic classification of each of the stars in the sample. The upper left panel shows the data, the top right panel shows the TPF with the aperture, and the middle and bottom panels show the frequency spectra (left) and the data phase-folded with the most prominent peaks in the frequency spectra (right).
Current usage metrics show cumulative count of Article Views (full-text article views including HTML views, PDF and ePub downloads, according to the available data) and Abstracts Views on Vision4Press platform.
Data correspond to usage on the plateform after 2015. The current usage metrics is available 48-96 hours after online publication and is updated daily on week days.
Initial download of the metrics may take a while.