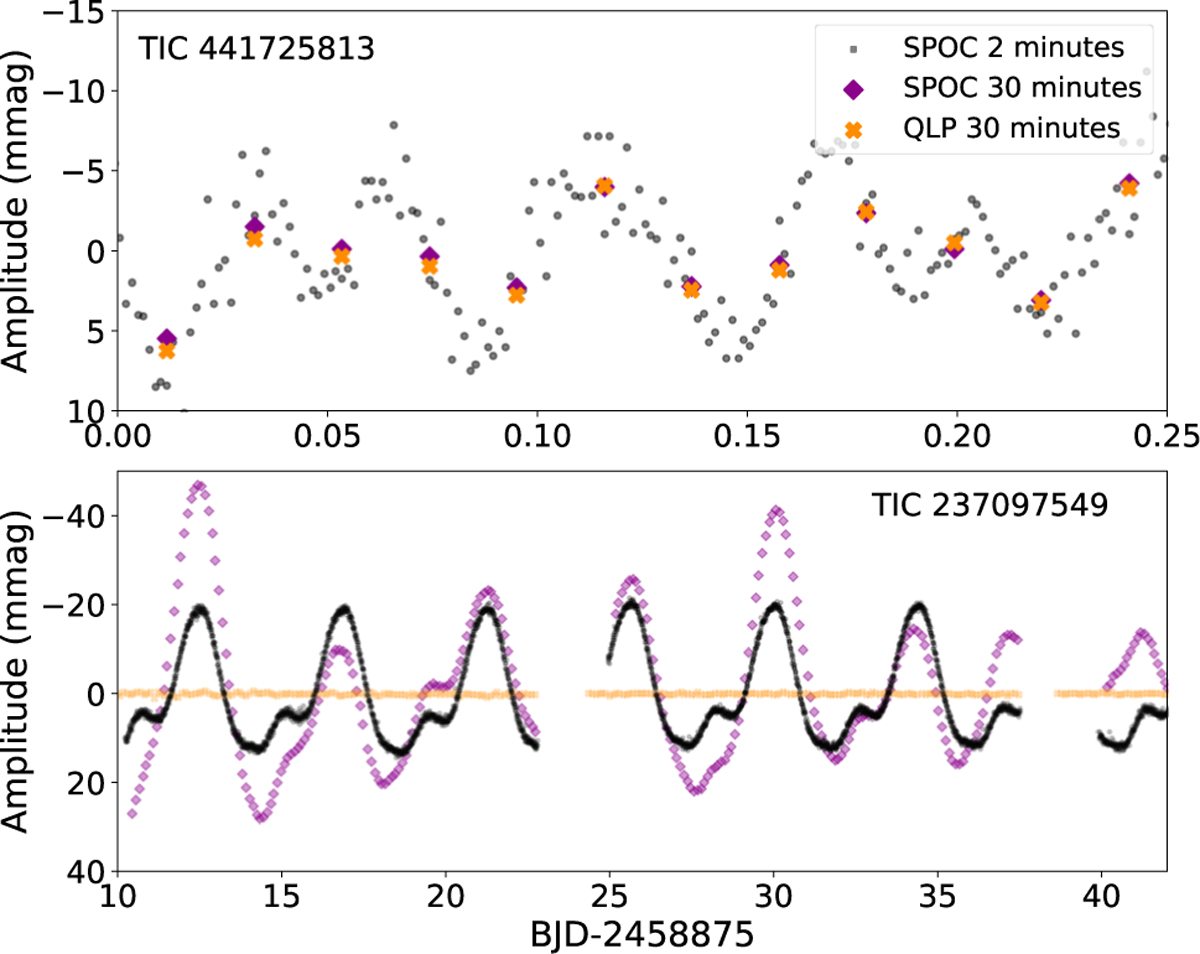
Fig. 2
Download original image
Comparison of the data with different samplings obtained using different routines. In low-amplitude short-period variable stars, the LC data from QLP and SPOC data products give similar results but with smaller amplitudes (the upper panel). The bottom panel shows that in stars with amplitudes of the order of tens of millimagnitudes, the LC data can already suffer from some instrumental variations (magenta points), but the QLP routine (orange points) fully removes the variability. In both stars, the LC data are less reliable than the SC data in determining the amplitudes of brightness variations and in determining the variability type.
Current usage metrics show cumulative count of Article Views (full-text article views including HTML views, PDF and ePub downloads, according to the available data) and Abstracts Views on Vision4Press platform.
Data correspond to usage on the plateform after 2015. The current usage metrics is available 48-96 hours after online publication and is updated daily on week days.
Initial download of the metrics may take a while.