Fig. 11
Download original image
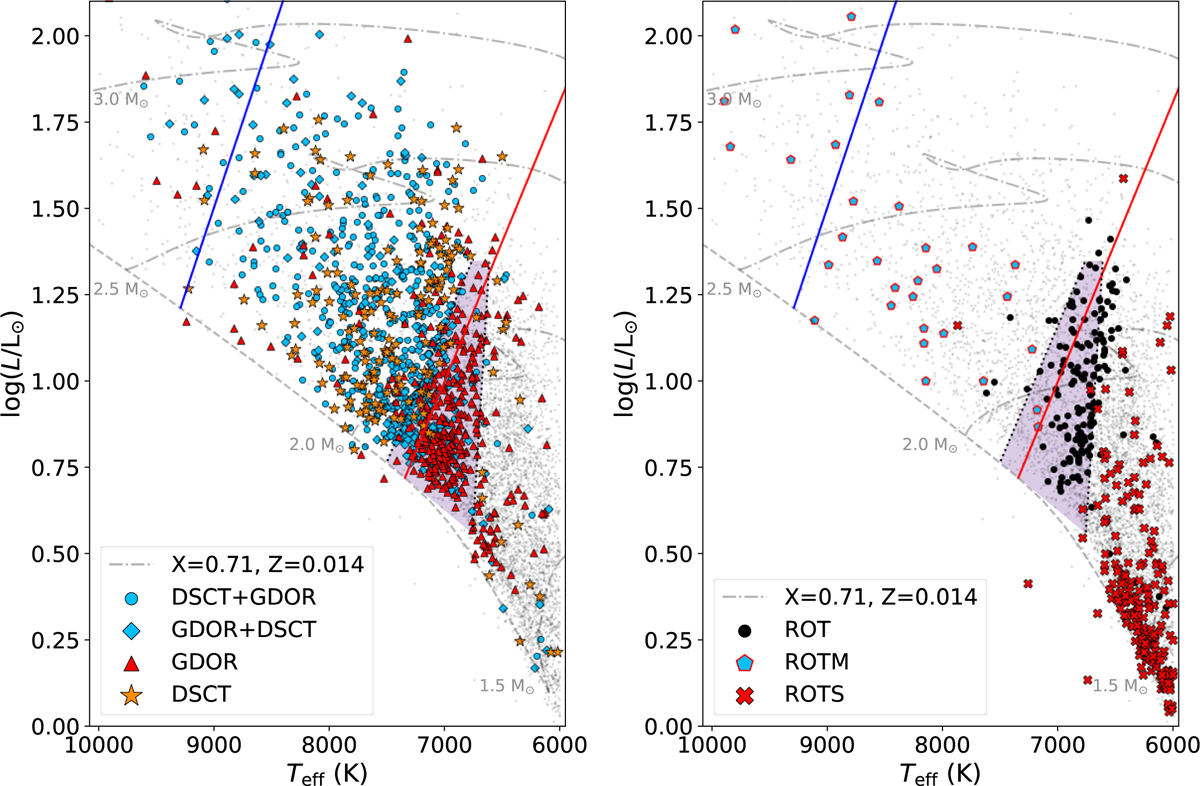
Hertzsprung–Russell diagram showing pulsating stars (left panel) and rotationally modulated stars (right-hand panel). The dashed line shows the zero-age main sequence, dash-dotted lines show the evolutionary tracks for stars with different masses, all taken from Murphy et al. (2019). The blue and red continuous lines show the empirical boundaries of the instability strip determined by Murphy et al. (2019). The shaded area enclosed by the dotted lines shows the GDOR instability region, following Dupret et al. (2005). The grey dots show all stars including non-variable stars in our sample.
Current usage metrics show cumulative count of Article Views (full-text article views including HTML views, PDF and ePub downloads, according to the available data) and Abstracts Views on Vision4Press platform.
Data correspond to usage on the plateform after 2015. The current usage metrics is available 48-96 hours after online publication and is updated daily on week days.
Initial download of the metrics may take a while.