Fig. 9.
Download original image
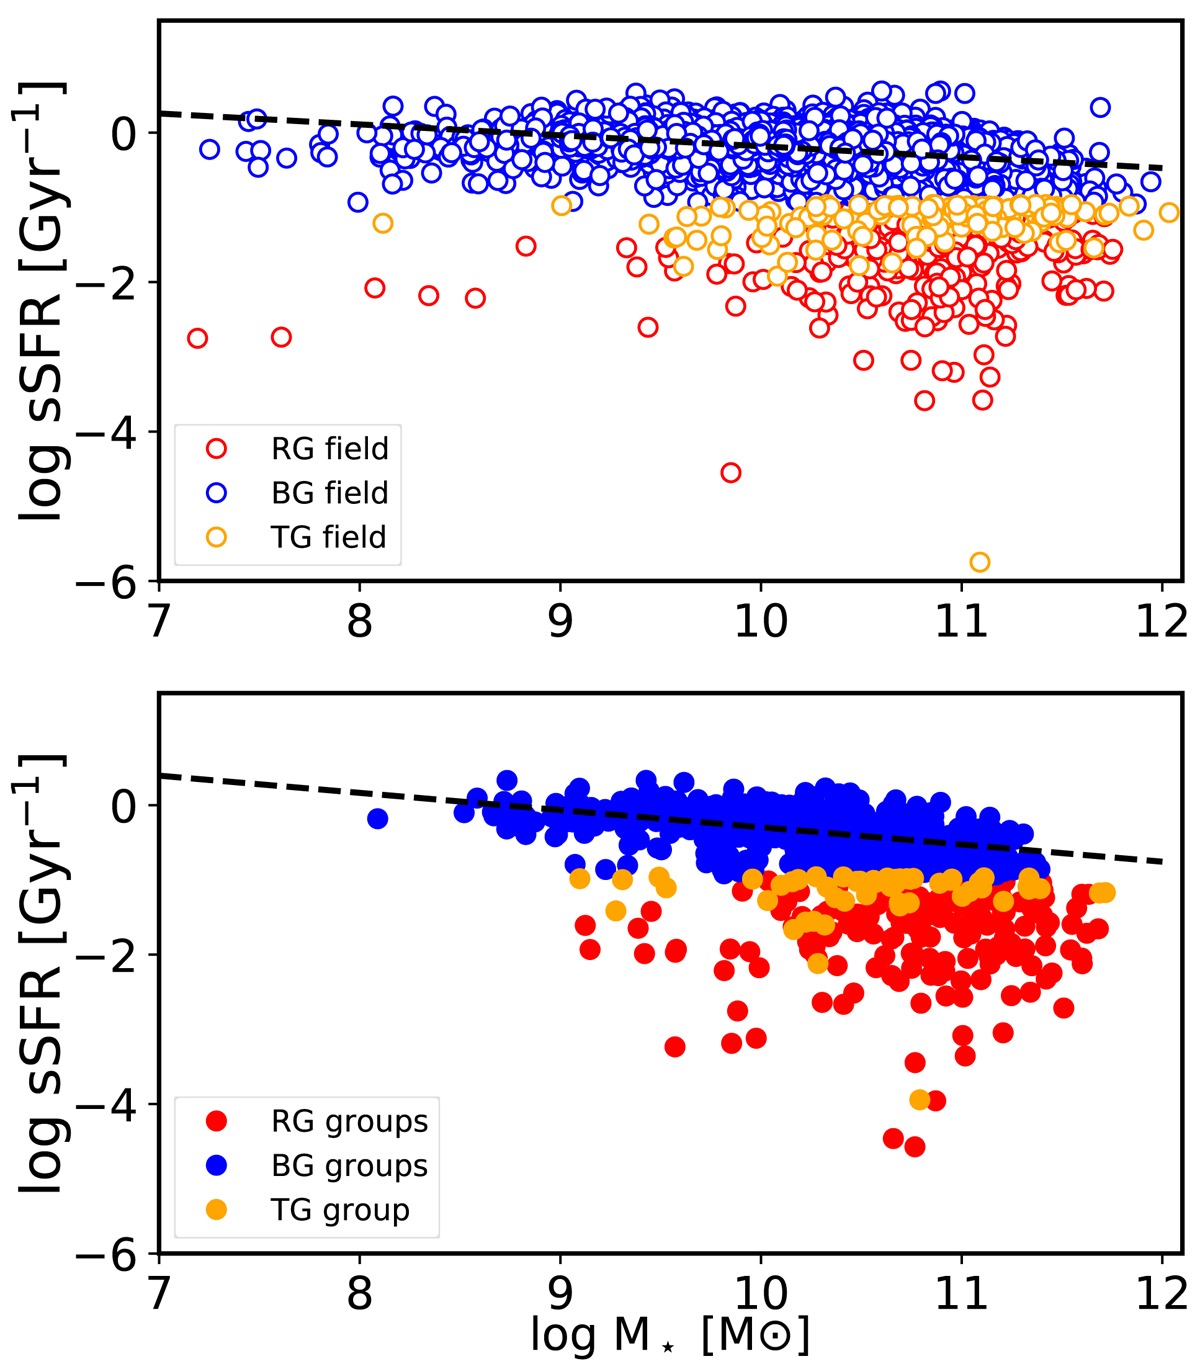
log sSFR-log M⋆ relation for galaxies in the field (upper panel) and those in a group environment (bottom panel). Red and blue galaxies are represented by blue and red circles, respectively. Blue galaxies that are in a transition phase (see Sect. 6.3) are represented by orange circles. Black dashed lines represent the fit obtained for the SFMS in each set of galaxies.
Current usage metrics show cumulative count of Article Views (full-text article views including HTML views, PDF and ePub downloads, according to the available data) and Abstracts Views on Vision4Press platform.
Data correspond to usage on the plateform after 2015. The current usage metrics is available 48-96 hours after online publication and is updated daily on week days.
Initial download of the metrics may take a while.