Fig. 8.
Download original image
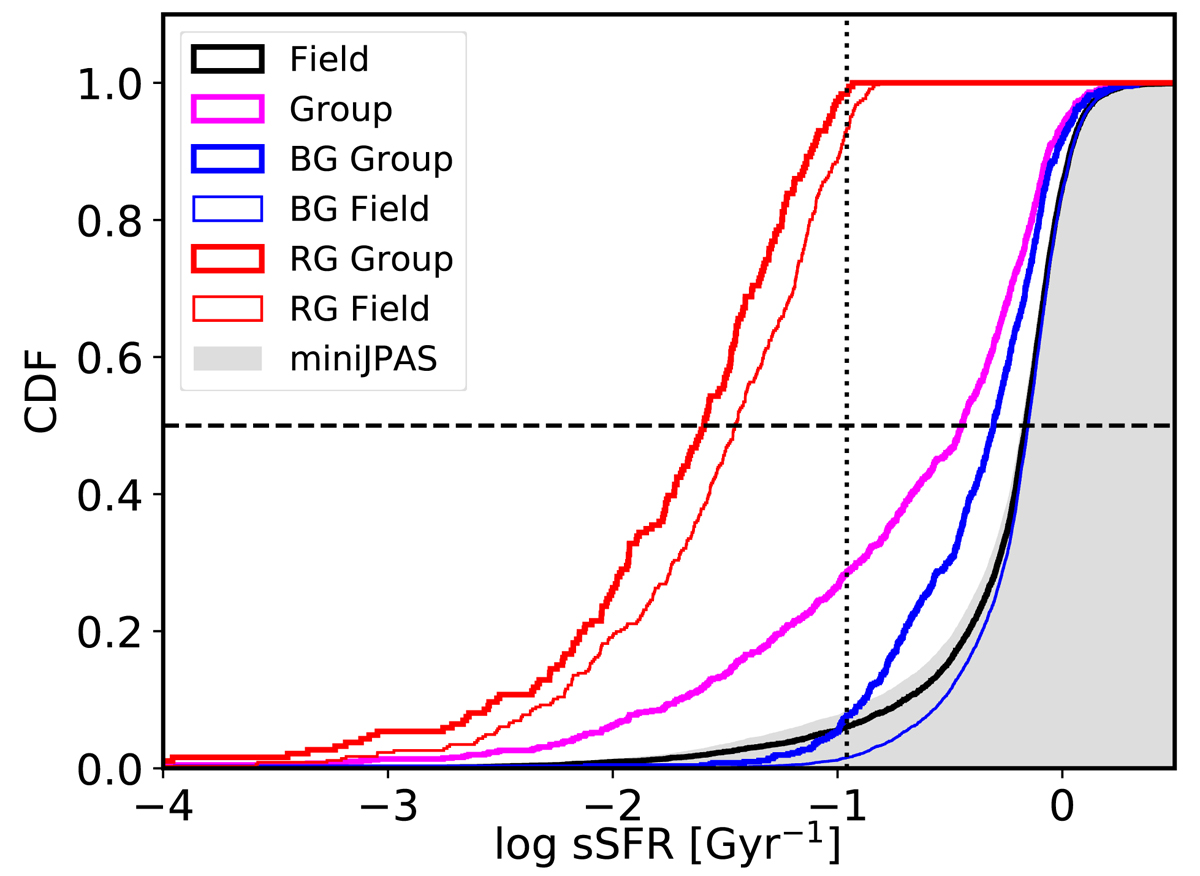
Cumulative distribution of the specific SFR of the whole sample (light grey), the field galaxies (black line), the galaxy members of the AMICO groups (magenta), red galaxies in groups (dark red) and in the field (light red), and blue galaxies in groups (dark blue) and in the field (light blue). The vertical line shows the sSFR limit below which the galaxies are considered to be quenched.
Current usage metrics show cumulative count of Article Views (full-text article views including HTML views, PDF and ePub downloads, according to the available data) and Abstracts Views on Vision4Press platform.
Data correspond to usage on the plateform after 2015. The current usage metrics is available 48-96 hours after online publication and is updated daily on week days.
Initial download of the metrics may take a while.