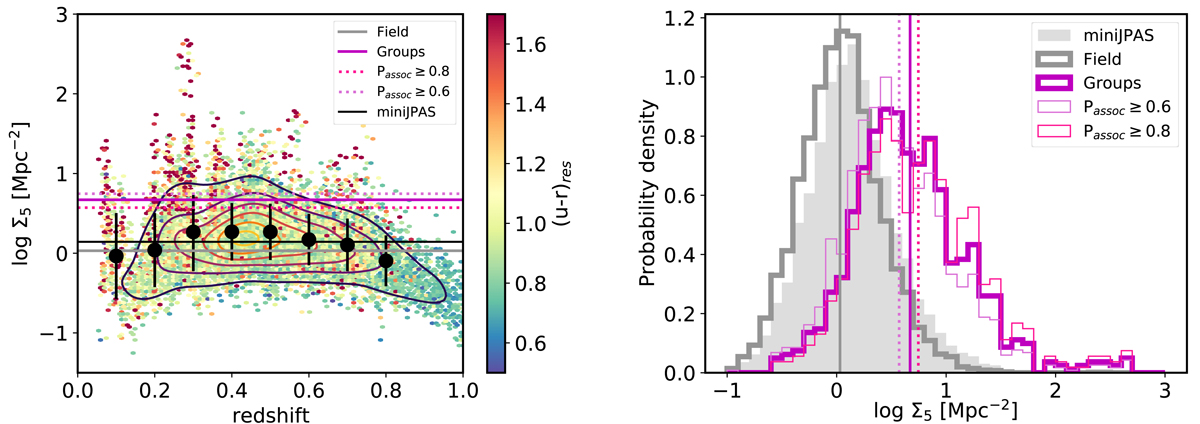
Fig. 5.
Download original image
Left panel: distribution in redshift of log Σ5. The contours show the density distribution of the points. The average values in different redshift bins are shown as black points. The black line shows the average log Σ5 for all the miniJPAS galaxies; and magenta and blue lines show the average log Σ5 for galaxies in groups and in the field environment, respectively. Dashed lines are at the average log Σ5 for galaxies with Passoc > 0.6 or 0.8. The colour bar shows the distribution of the rest-frame (u − r) colour. Vertical structures are groups in miniJPAS. Right panel: distribution of log Σ5 for miniJPAS galaxies (grey area) and field galaxies (grey line), and galaxies in a group (magenta) environment. Vertical lines show the positions of the average values.
Current usage metrics show cumulative count of Article Views (full-text article views including HTML views, PDF and ePub downloads, according to the available data) and Abstracts Views on Vision4Press platform.
Data correspond to usage on the plateform after 2015. The current usage metrics is available 48-96 hours after online publication and is updated daily on week days.
Initial download of the metrics may take a while.