Fig. 4.
Download original image
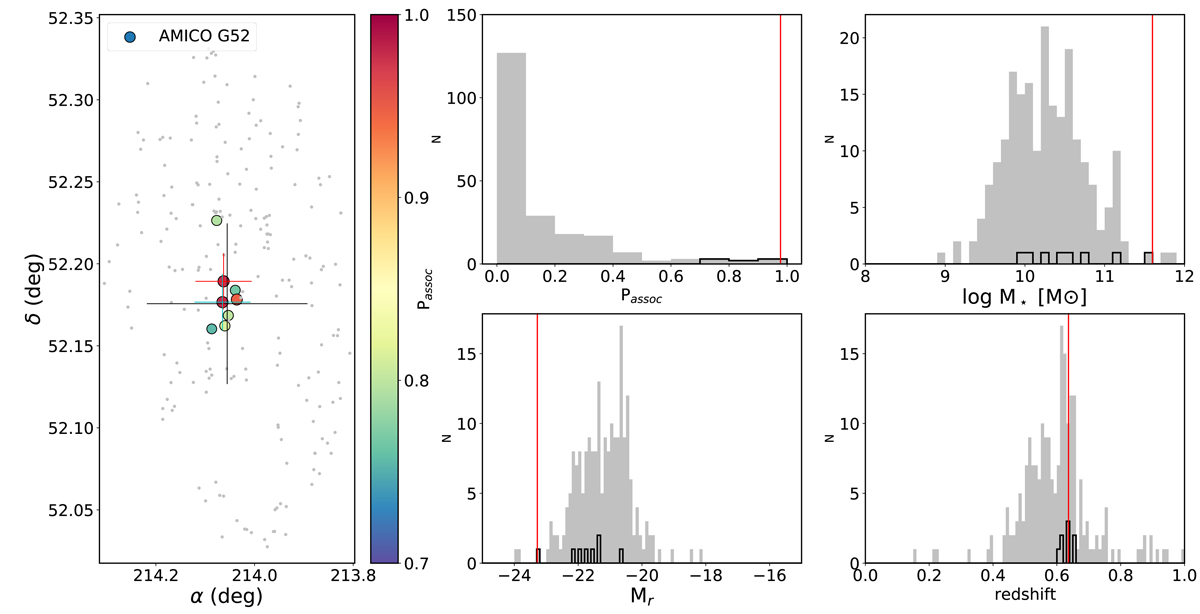
Distribution in the sky of the galaxy members listed in the catalogue of the AMICO group G52 (left panel). Objects in the catalogue with Passoc < 0.7 are plotted with grey dots. The galaxies with Passoc (≥0.7) are shown with circles that are coloured according to their Passoc. The most massive galaxy and the galaxy with the highest Passoc are marked by a red and a cyan cross, respectively. The group centre is also marked with a large black cross. Right panels: distribution of Passoc in the catalogue, the stellar mass, absolute magnitude in the r band, and redshift. The position of the BGG is marked with a red vertical line. The distribution of the galaxy members (Passoc ≥ 0.7) is shown with the black histogram.
Current usage metrics show cumulative count of Article Views (full-text article views including HTML views, PDF and ePub downloads, according to the available data) and Abstracts Views on Vision4Press platform.
Data correspond to usage on the plateform after 2015. The current usage metrics is available 48-96 hours after online publication and is updated daily on week days.
Initial download of the metrics may take a while.