Fig. 3.
Download original image
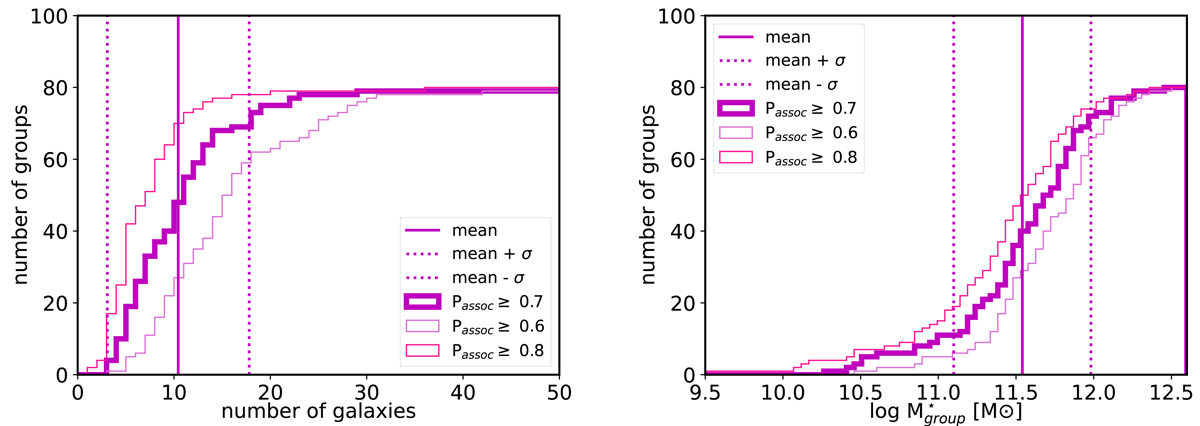
Left panel: cumulative distribution of the number of galaxy members in the AMICO groups. The distribution is derived for three values of Passoc as indicated in the inset. The vertical solid line is the average number of galaxy members per group; the dashed lines show ±1 sigma. Right panel: cumulative distribution of the group stellar mass.
Current usage metrics show cumulative count of Article Views (full-text article views including HTML views, PDF and ePub downloads, according to the available data) and Abstracts Views on Vision4Press platform.
Data correspond to usage on the plateform after 2015. The current usage metrics is available 48-96 hours after online publication and is updated daily on week days.
Initial download of the metrics may take a while.