Fig. 2.
Download original image
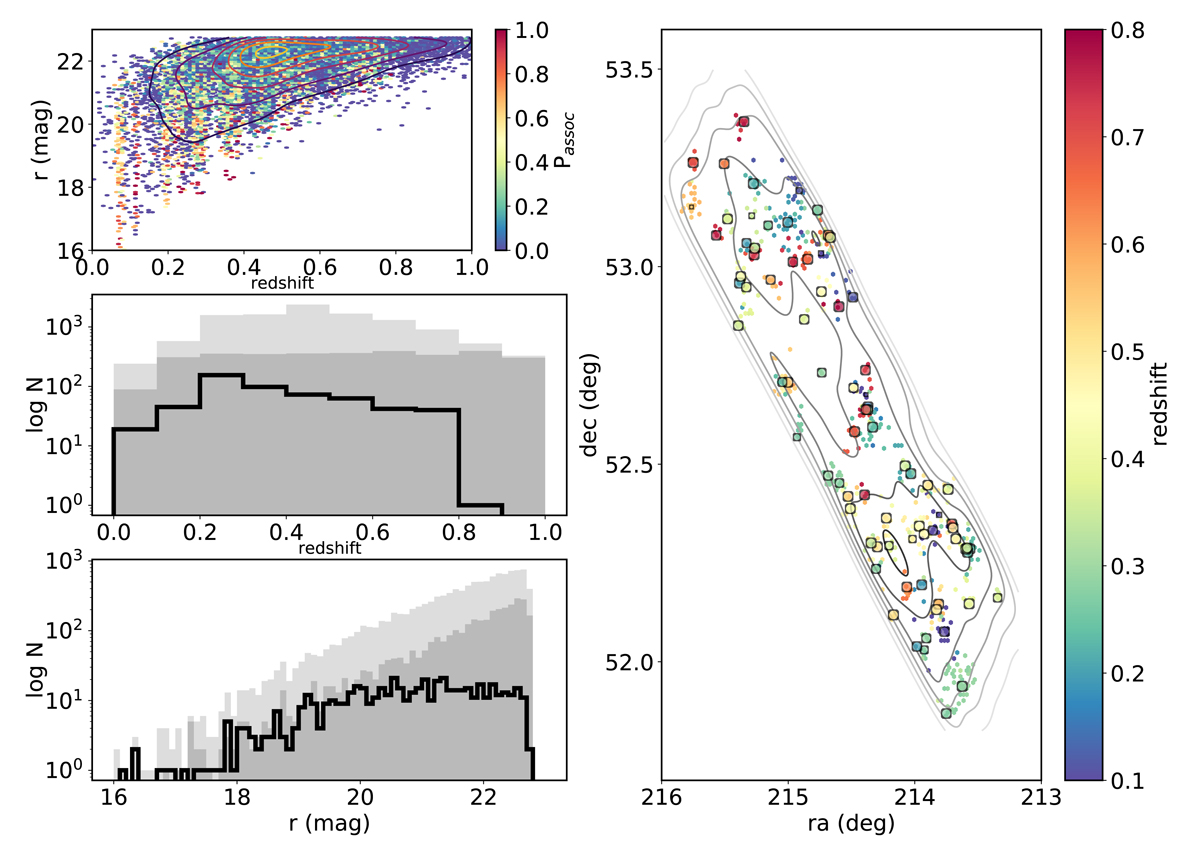
Observational properties of the sample and distribution of the AMICO galaxy members. Upper-left panel: redshift–magnitude diagram for the whole sample colour coded according to the probabilistic association, Passoc. Middle-left panel: redshift distribution. Bottom panel: rSDSS (MAG_AUTO) distribution. Here we show the galaxies in a group environment (black line), and galaxies in the field (grey histograms). The distributions of the full miniJPAS sample of galaxies are also shown (light grey histograms). Right panel: contours show the density galaxy map distribution of the whole miniJPAS sample analysed here. The points show the distribution of galaxies in groups; the circles are the brightest and most massive galaxy of each AMICO group. Points are coloured according to photo-z.
Current usage metrics show cumulative count of Article Views (full-text article views including HTML views, PDF and ePub downloads, according to the available data) and Abstracts Views on Vision4Press platform.
Data correspond to usage on the plateform after 2015. The current usage metrics is available 48-96 hours after online publication and is updated daily on week days.
Initial download of the metrics may take a while.