Fig. 19.
Download original image
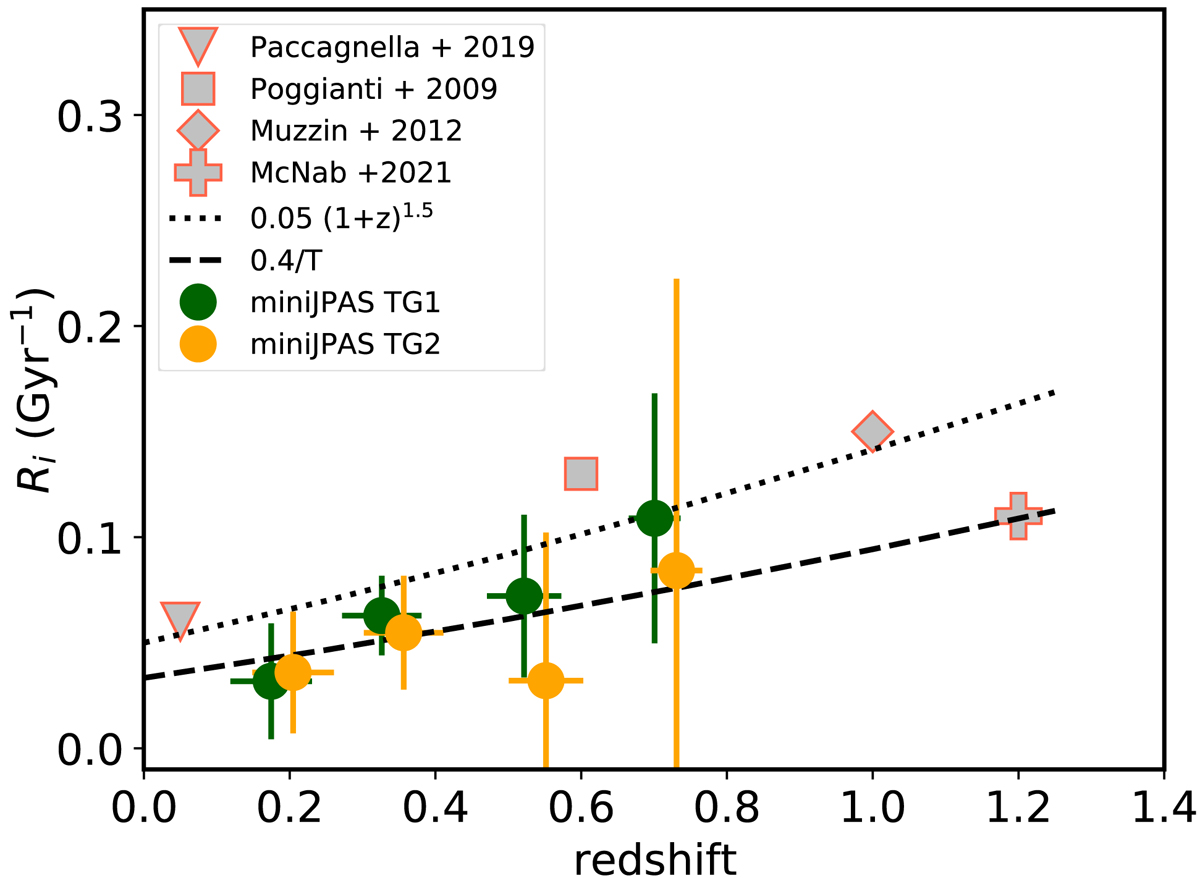
Rate of group galaxy quenching in four redshift intervals for miniJPAS. The rate is calculated using two proxies for selecting transition galaxies (orange and green points). Results from Fig. 15 in McNab et al. (2021) are shown (grey-red points). The dashed line is QFE/T for QFE = 0.4, and the dotted line represents the evolution of the inverse of the dynamical time, (1 + z)3/2 scaled to R = 0.05 Gyr−1 at z = 0 (see the text for further explanation).
Current usage metrics show cumulative count of Article Views (full-text article views including HTML views, PDF and ePub downloads, according to the available data) and Abstracts Views on Vision4Press platform.
Data correspond to usage on the plateform after 2015. The current usage metrics is available 48-96 hours after online publication and is updated daily on week days.
Initial download of the metrics may take a while.