Fig. 18.
Download original image
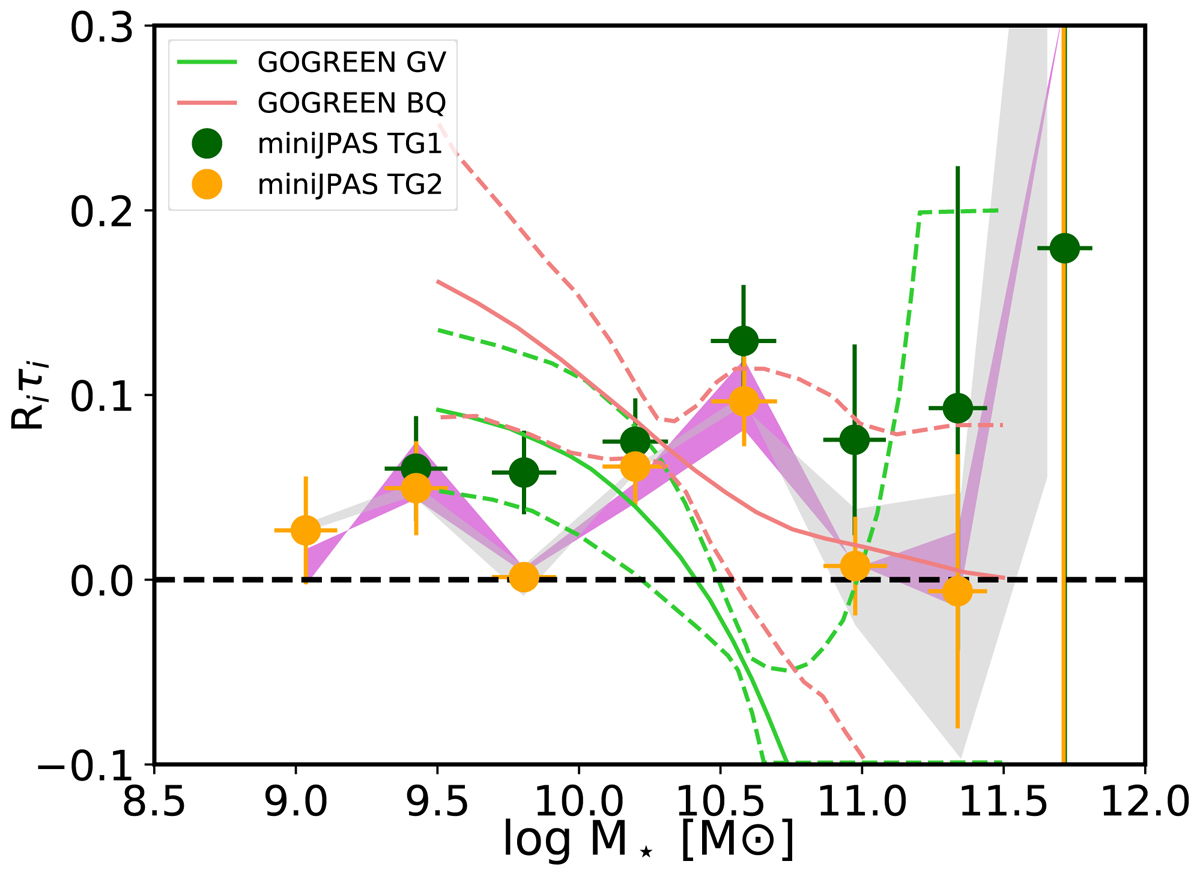
Riτi as a function of galaxy stellar mass, calculated from Eq. (4). Orange points represent the values obtained using the colour–sSFR definition for the transition galaxies (TG2). Green points represent the values obtained using the Δ SFR definition for transition galaxies (TG1). The magenta and grey shades correspond to the different assumptions on Passoc for the group members and field galaxies, respectively. Light green and coral lines are the results from McNab et al. (2021) for the green and blue quiescent galaxy populations in GOGREEN. Dashed lines (same colours) represent the 68% confidence limits of their fit.
Current usage metrics show cumulative count of Article Views (full-text article views including HTML views, PDF and ePub downloads, according to the available data) and Abstracts Views on Vision4Press platform.
Data correspond to usage on the plateform after 2015. The current usage metrics is available 48-96 hours after online publication and is updated daily on week days.
Initial download of the metrics may take a while.