Fig. 10.
Download original image
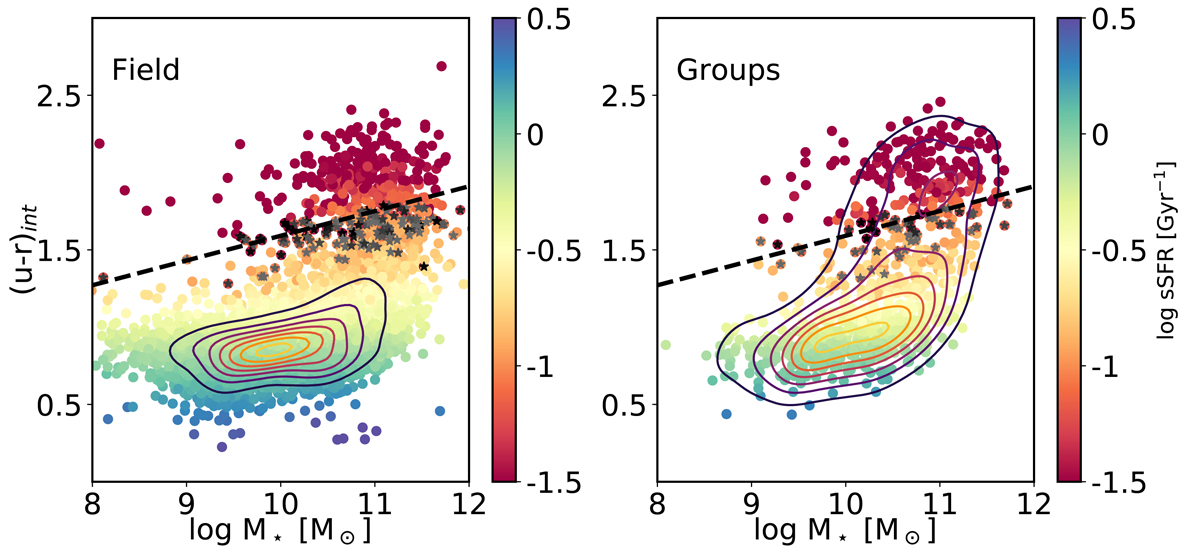
Mass–colour (rest-frame (u − r) corrected for extinction) for the field galaxy population (left panel) and galaxies in a group environment (right panel). Dashed lines show the ![]() for the mean redshift of the galaxy population, to separate blue and red galaxies. Grey stars represent the blue galaxies that are considered to be in a transition phase (see Sect. 6.3). The contours represent the density distribution of points in the colour–mass plane.
for the mean redshift of the galaxy population, to separate blue and red galaxies. Grey stars represent the blue galaxies that are considered to be in a transition phase (see Sect. 6.3). The contours represent the density distribution of points in the colour–mass plane.
Current usage metrics show cumulative count of Article Views (full-text article views including HTML views, PDF and ePub downloads, according to the available data) and Abstracts Views on Vision4Press platform.
Data correspond to usage on the plateform after 2015. The current usage metrics is available 48-96 hours after online publication and is updated daily on week days.
Initial download of the metrics may take a while.