Fig. 1.
Download original image
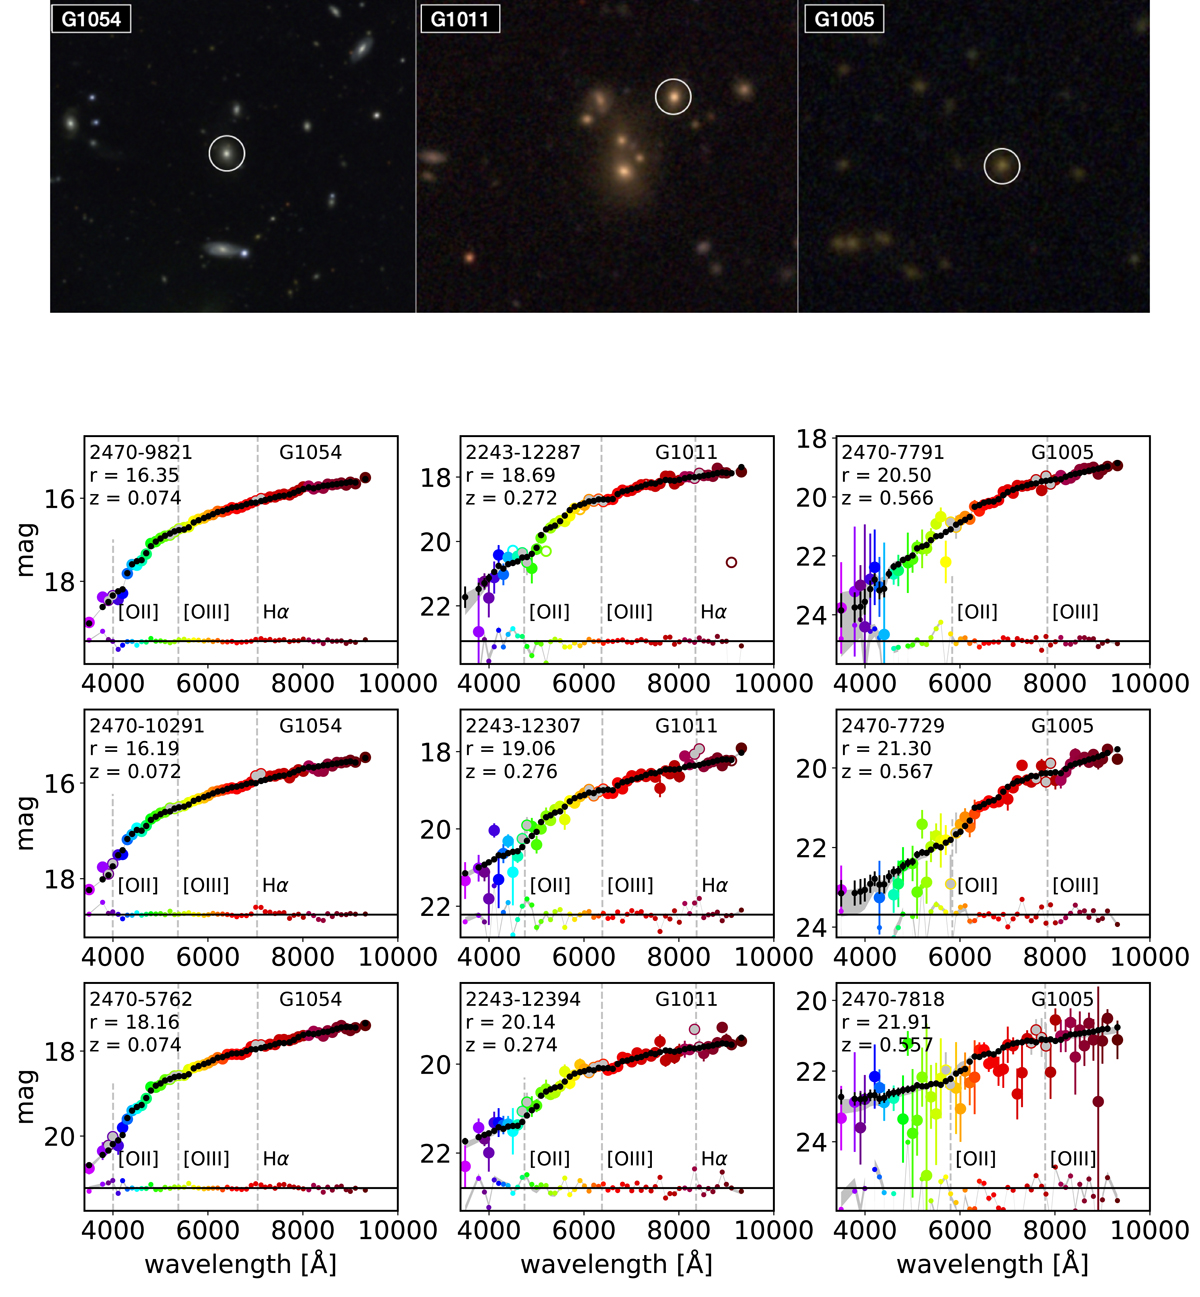
Images and J-spectra of several galaxy members in three AMICO groups. Upper panel: images of the central part of G1054, G1011, and G1005. The most massive galaxy in each group is marked with a circle. Middle and bottom panels: J-spectra (MAG_AUTO) of galaxy members of G1054, G1011, and G1005, as labelled. The most massive galaxy (marked with a circle in the upper panel), the second most massive galaxy in each group, and other galaxy members of the group are shown. J-spectra are shown as coloured dots, while the best model fitted by BaySeAGal for each J-spectrum is plotted as a black point; the grey band shows the magnitudes of the mean model ± one σ uncertainty level. The differences between the observed and best model fitted magnitudes are plotted as small coloured points around the black bottom line. Masked filter (white circles) and filters overlapping with the emission lines Hα, [NII], [OIII], Hβ, and [OII] (grey circles) are not used in the fits. The dashed vertical lines show the wavelength positions where the Hα, [OIII], and [OII] could be in emission at the redshift of each galaxy. The Hα line is clearly detected in the galaxies 2243-12307 and 2243-12394 that belong to G1011, and 2470-10291 of G1054.
Current usage metrics show cumulative count of Article Views (full-text article views including HTML views, PDF and ePub downloads, according to the available data) and Abstracts Views on Vision4Press platform.
Data correspond to usage on the plateform after 2015. The current usage metrics is available 48-96 hours after online publication and is updated daily on week days.
Initial download of the metrics may take a while.