Fig. 9
Download original image
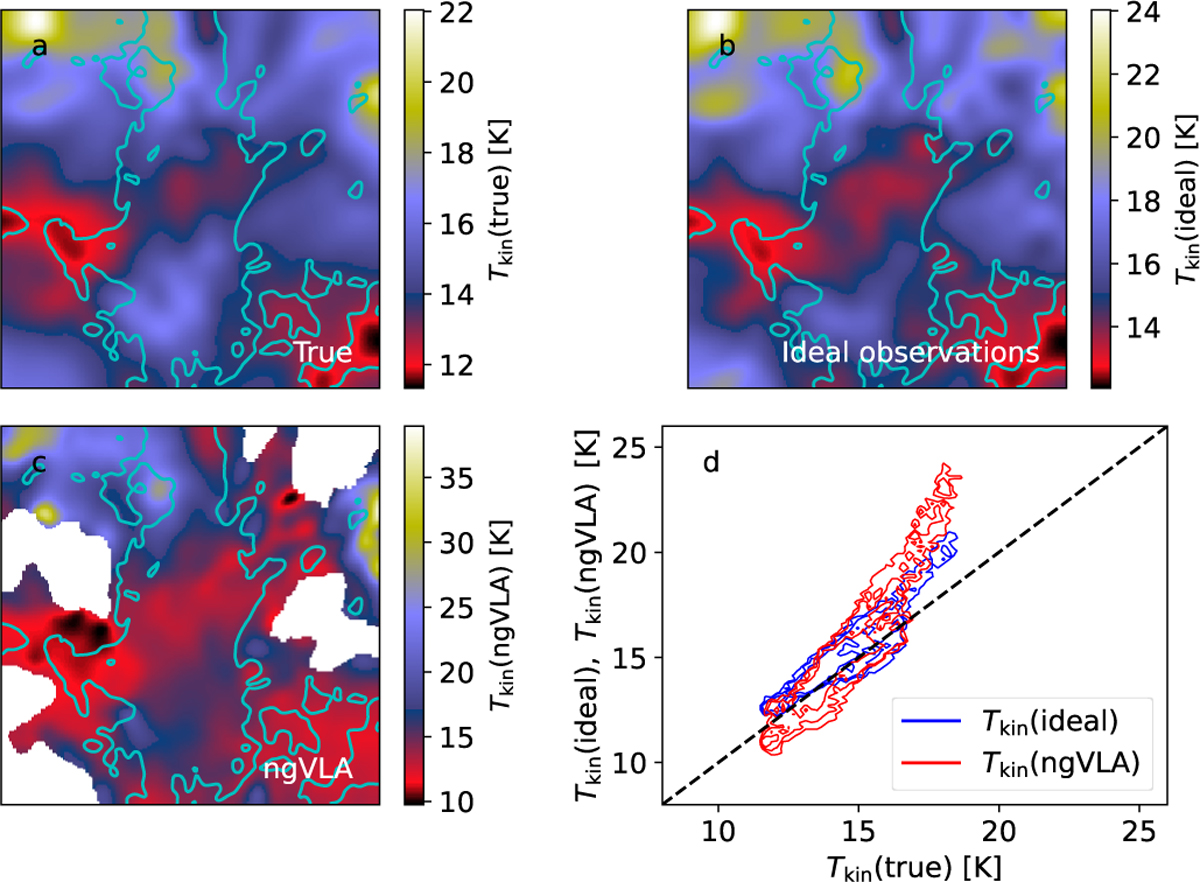
Comparison of kinetic-temperature estimates. The frames show (a) true density-weighted and LOS-averaged kinetic temperature ![]() in the 3D model, (b) estimates
in the 3D model, (b) estimates ![]() from ideal NH3 observations, (c) estimates
from ideal NH3 observations, (c) estimates ![]() from synthetic ngVLA observations, and (d) correlations of
from synthetic ngVLA observations, and (d) correlations of ![]() (blue contours) and
(blue contours) and ![]() (red contours) against
(red contours) against ![]() . In frame d, the plot includes pixels N(H2) > 5 × 1022 cm−2 (corresponding to the cyan contour in frames a-c), and the contours are drawn at 20, 50, and 80% of the maximum value. All data are shown at 3″ resolution.
. In frame d, the plot includes pixels N(H2) > 5 × 1022 cm−2 (corresponding to the cyan contour in frames a-c), and the contours are drawn at 20, 50, and 80% of the maximum value. All data are shown at 3″ resolution.
Current usage metrics show cumulative count of Article Views (full-text article views including HTML views, PDF and ePub downloads, according to the available data) and Abstracts Views on Vision4Press platform.
Data correspond to usage on the plateform after 2015. The current usage metrics is available 48-96 hours after online publication and is updated daily on week days.
Initial download of the metrics may take a while.